Camera-Based Ergonomics Assessment |
Developing a method for use in manual assembly
| Journal | Industry 4.0 Science |
| Issue | Volume 41, 2025, Edition 5, Pages 120-126 |
| Open Access | https://doi.org/10.30844/I4SE.25.5.116 |
| Bibliography | Share | Cite | Download |
Abstract
Article
The focus of this article is the development and validation of a method for the automated assessment of the ergonomics of assembly work in industry. The aim is to investigate how an information system can identify non-ergonomic movements in process sequences in order to determine approaches for improvement. Ergonomics in the workplace has been recognized as highly relevant by companies. Measures such as the use of exoskeletons and driverless transport vehicles, for example, have already been investigated [1, 2].
In order to identify and avoid increased stress in the workplace, the ergonomics of affected workplaces can be examined and evaluated. Methods such as the Rapid Upper Limb Assessment (RULA) or the Ovako Working Posture Analysing System (OWAS) are used for this purpose. However, the manual evaluation required for these assessments is time-consuming and resource-intensive. Instead, one could consider, for example, automating the RULA method using approaches such as image processing.
Ergonomics assessment in practice
The most used and therefore most established methods for assessing working postures in assembly are OWAS, Rapid Entire Body Assessment (REBA) and RULA, with RULA being the most used in both literature and practice [3]. As this method focuses on the upper body, which is more heavily strained during assembly work, it is also used here as a basis.
The RULA method was developed in 1993 by McAtamney and Nigel Corlett and is used for quick and easy ergonomics assessment. The method does not require any special equipment and can help highlight a range of measures for improving ergonomics [4]. It is based on a numerical system that classifies the posture of the respective person on a scale from 1 (acceptable if not repeated over a longer period of time) to 7 (investigation and adjustment must be carried out immediately to reduce the risk of injury to the person concerned). Different body regions are observed and posture is evaluated based on the angle of joints.
In addition to posture evaluation, the force acting on the person from outside (for example the weight being carried) also affects the ergonomics assessment. A posture that is performed particularly frequently or statically also has an exacerbating influence on the risk of injury and thus a negative influence on the RULA evaluation. These observations are translated into an overall evaluation using various lookup tables.
Several preliminary studies have already been conducted with the aim of automating ergonomics assessment, particularly using inertial measurement units (IMUs) and, in recent years, depth cameras [5]. This article examines the use of markerless depth cameras for assessing assembly work in an application-oriented laboratory scenario. These camera systems are more practical than IMUs and can also be flexibly integrated into the working environment [6]. In addition, an autocorrelation method for the automatic detection of movement repetition is implemented for the first time. A holistic concept is developed and implemented as a demonstrator.
Methodological concept for automated ergonomics assessment
Figure 1 illustrates the concept for automated RULA evaluation based on image processing.
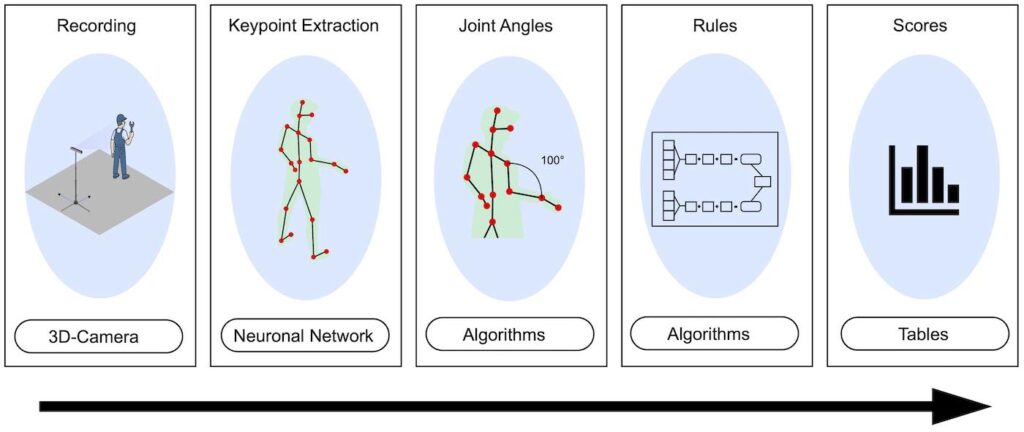
The concept can be depicted as a multi-stage process with different modules. First, the workflow is recorded with a 3D camera. Care should be taken to ensure that the camera setup does not interfere with the work being performed.
In the second step, the recorded data is used to derive so-called “keypoints” using an artificial neural network (ANN). Various algorithms and models already exist for this purpose, such as the open-source product OpenPose [7]. In this investigation, the software library of the 3D camera was employed to identify body postures. The detected points represent the joints of the human body in the form of Cartesian coordinates. In a subsequent processing step, the joint angles relevant for the RULA method can be derived algorithmically from the recorded points.
The rule-based evaluation criteria of RULA can then be applied and the corresponding scores calculated. An autocorrelation method is used to analyze repetitive movement sequences. Here, the motion data is recorded over a certain period of time and the temporal development of the body points is analyzed. By calculating the distance between different time windows within the recorded sequence, repetitive movements can be identified. This means that the movement that affects the most keypoints and thus body parts defines the relevant repetitive movement. In this way, a method has been developed that does not require the generation of training data, as is the case in machine learning.
For a holistic ergonomics assessment, a static value is assigned to the score for the weight carried. After the evaluation is complete, all calculated individual values are combined into an overall score. The requirements for such an assessment are minimal and limited to lighting and suitable camera positioning.
Reliability of the method
To evaluate the reliability of the method, a simulated tire assembly process for automobile production was carried out under laboratory conditions. It should be noted that no measures were taken to optimize the working environment, such as increased lighting or high-contrast backgrounds, in order to guarantee realistic conditions.
The simulation of the assembly process was carried out in several steps: First, the participants took the necessary materials and tools from a shelf and placed them in a box on the floor that was intended for transport. They then carried the box a short distance to a test bench with a wheel suspension and placed it back on the floor.
The next step was to simulate the mounting of the tire on the test bench. To avoid endangering the health of the test subjects, a wooden dummy tire was used instead of a real tire. The test subjects were instructed to remove each component individually from the box, which required them to bend down repeatedly. After the tire was secured with five screws and the assembly was checked, the tire was removed again, the material put back in the box and returned to the shelf.
The process was completed twice to investigate differences in movement behavior and their influence on the ergonomics assessment. For the first round, participants performed the tasks according to their individual, natural movement patterns. The repeated bending movement remained part of the process—an ergonomically unfavorable strain that, according to the RULA assessment, occurred so frequently that it had a negative impact on the overall assessment.
In the second round, however, participants were given specific instructions to use ergonomically favorable movement patterns. In particular, lifting from the back was avoided and the previously forced bending movement was removed from the sequence. This allowed the effects of these posture adjustments to be examined in a targeted manner. One test run lasted approximately three minutes on average.
During this series of assessments, ten subjects were recorded by 3D cameras at a distance of approximately 3.5 meters while performing the process. The video recordings were evaluated both automatically and manually by an ergonomics expert using the RULA method. For the evaluation, 39 random snapshots were selected from the videos. The results of the two evaluations were then examined for consistency. For this purpose, the linearly weighted Cohen’s kappa was used, which, according to Landis and Koch’s interpretation [8], can classify the strength of agreement from low (κ<0.00 ) to (almost) perfect (0.81≤κ≤1.00 ). A value of κ≥0.40 is considered acceptable [9]. The ergonomic difference between the movements can be seen in the results (Fig. 2).
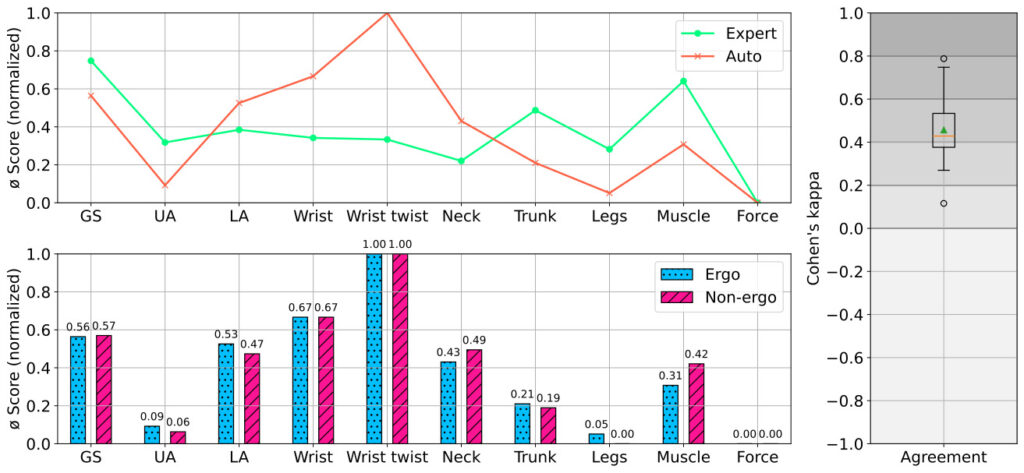
The upper left graph illustrates the differences in the evaluation of all recordings between the expert and the automated method. The ordinates of the graphs in the left-hand section of the image show, through their normalized representation, whether the individual scores are at the upper or lower end of the rating scales. The expert determines a slightly higher Grand Score (GS) on average than the automated system.
A similar pattern can be observed in the evaluation of the upper arms (UA), the trunk, the legs, and the value for the repetitive movements (Muscle). The opposite is true for the lower arms (LA), wrists, and wrist twist. The highest possible score is always selected for the wrist twist. This is due to the algorithm used to derive the skeleton data, which was unable to correctly generate the necessary keypoints in the hand area.
The bar chart below shows the average scores for all video recordings evaluated by the automated system. The ratings of the ergonomic process (Ergo) were compared with those of the non-ergonomic (Unergo) process. The GS for the ergonomic process is slightly lower on average than for the non-ergonomic process. This is more pronounced for the neck and muscle scores. The upper arms, lower arms, trunk, and legs achieved higher scores in the ergonomic process. The box plot on the right shows the consistency between the 39 evaluations made by the expert and via the automated method. The average agreement value is 0.88 (κ≈0.46 ), which indicates an acceptable level of agreement between the two evaluation approaches.
Discussion of the results and final considerations
Automated ergonomics assessment proved to be more efficient than manual expert assessment. The expert evaluation of all snapshots took approximately 90 minutes, while the automated evaluation required a computing time of approximately 10 minutes. The manual analysis of individual joint angles proved to be time-consuming and unreliable, as it is based on subjective estimates. This could mean that the automated evaluation delivers more accurate results, provided that the three-dimensional keypoints of the spatially captured person have been generated correctly.
In addition, automation allows for a complete evaluation of all snapshots, which is not feasible manually within the same time frame. The present results are in line with the existing state of research, in which markerless camera systems have already been successfully used for ergonomics assessment. The value of 0.95 (κ≈0.46 ) is close to the value of 0.94 (κ=0.47 ) determined by Humadi, who found that ergonomics assessment was consistent between a markerless and a marker-based camera system [6]. This shows that markerless systems not only deliver results comparable to marker-based methods but can also achieve a similar level of agreement with expert evaluations.
Nevertheless, the κ value also points to some limitations: The evaluation made by the expert is subjective and therefore not necessarily to be understood as a valid reference value. This limits the informative value of this key figure with regard to the validity of the automated method. Despite this limitation, Cohen’s κ is still a useful measure for assessing the reliability between the automated and the expert method, as it takes random matches into account and objectively measures the consistency of the evaluations.
A closer analysis of individual evaluations also shows that, in some cases, the extracted keypoints do not correspond exactly to the actual body positions. These deviations lead to discrepancies between the automated evaluation and the expert assessment, as can be seen in Figure 2, for example. Some possible causes for this are problems in image processing, such as occlusion or low contrast. Errors in determining keypoints occurred repeatedly, particularly in the hands. This could explain why the κ value is moderate, at 0.46. This average agreement can be classified as acceptable [9].
This article thus shows that automated ergonomics assessment using the RULA method with relevant system specifications and algorithmic detection of repeated movements can deliver acceptable results even in application-oriented assembly scenarios and complex environments. However, the inaccuracies of the keypoints lead to limitations in the detection of repetitions. Strong noise in the movement data over time limits the reliability of repetitive movement detection.
The autocorrelation method functions well under certain conditions but fails in more complex scenarios. Nevertheless, the results in Figure 2 show that reducing repeated movements leads to a lower muscle score. This fact illustrates that also individual values of RULA can be useful when determining measures to improve ergonomics.
However, the evaluation also revealed potential for optimization. Further research could test approaches for detecting repetitions in movement profiles in order to improve the quality of the automated application of the RULA method. For example, a more comprehensive examination of the activities performed and their frequencies could enable a more precise determination of the muscle score in contrast to the autocorrelation method. Similar approaches have already been tested 10].
In addition, further studies should be conducted to optimize the detection of keypoints using markerless camera systems. In the future, more sophisticated camera systems with optimized algorithms for extracting joint points could be used. A fusion of several depth cameras to reduce occlusions and improve detection reliability is also a possibility.
This research has been partly funded by the European Regional Development Fund (ERDF) and the Bremer Aufbau-Bank (BAB) as part of the project “Detection and AI-based analysis of ergonomic data in manual assembly using wearables and machine vision techniques” (project number FUE0661B).
The original German version of this article can be accessed via DOI: 10.30844/I4SD.25.5.120
Bibliography
[1] Pupkes, B.; Petzoldt, C.; et al.: (In print) User Expectations, Requirements, and Applications of Exoskeletons: Insights from a Survey. In: Procedia CIRP.[2] Petzoldt, C.; Lütjen, M.; et al.: Operator 5.0: Intelligente Arbeitsergonomie im Automobilumschlag. In: Zeitschrift für wirtschaftlichen Fabrikbetrieb 117 (2022) 10, pp. 644-650.
[3] Kee, D.: Systematic Comparison of OWAS, RULA, and REBA Based on a Literature Review. In: International Journal of Environmental Research and Public Health 19 (2022) 1, p. 595.
[4] McAtamney, L.; Nigel Corlett, E.: RULA: a survey method for the investigation of work-related upper limb disorders. In: Applied Ergonomics 24 (1993) 2, pp. 91-99.
[5] Antonaci, F. G.; Olivetti, E. C.; et al.: Workplace Well-Being in Industry 5.0: A Worker-Centered Systematic Review. In: Sensors 17 (2024), No. 5473.
[6] Humadi, A.; Nazarahari, M.; et al.: In-field instrumented ergonomic risk assessment: Inertial measurement units versus Kinect V2. In: International Journal of Industrial Ergonomics 84 (2021), p. 103147.
[7] Cao, Z.; Hidalgo Martinez, G.; et al.: OpenPose: Realtime Multi-Person 2D Pose Estimation using Part Affinity Fields. In: IEEE Transactions on Pattern Analysis and Machine Intelligence 43 (2019) 1, pp. 172-186.
[8] Landis, J. R.; Koch, G. G.: The Measurement of Observer Agreement for Categorical Data. In: Biometrics 33 (1977) 1, pp. 159-174.
[9] Greve, W.; Wentura, D.: Wissenschaftliche Beobachtung: Eine Einführung. Weinheim 1997.
[10] Jathe, N.; Lütjen, M.; et al.: Intelligente Kontexterfassung im Automobilumschlag. In: Zeitschrift für wirtschaftlichen Fabrikbetrieb 118 (2023) 6, pp. 376-381.