Real-Time Monitoring of the Carbon Footprint for SMEs |
Sustainability in real time — from operation to finished products
| Journal | Industry 4.0 Science |
| Issue | Volume 41, Edition 3, Pages 102-109 |
| Bibliography | Share | Cite | Download |
Abstract
Keywords
Article
Focus on sustainability
Having access to real-time emissions data is critical for undertaking targeted and effective steps to reduce CO2 emissions. This is true for all processes, from production to delivery. Political frameworks such as the CSRD Directive and the European Green Deal are actively driving this change. Companies are increasingly obliged to systematically record, evaluate and disclose their CO₂ emissions—with the aim of identifying potential savings and using resources more efficiently [1]. At the same time, the requirements for transparent communication along the entire supply chain are increasing [2].
At present, however, much emissions data is still based on manual collection, subsequent processing, and generalized average values—mainly due to a lack of data availability, complex data collection processes and insufficient data quality [3]. This article shows how small and medium-sized companies can use sensor technology and open source solutions to initiate the first steps towards digital, sustainable production using a Machine Carbon Footprint (MCF).
The Machine Carbon Footprint
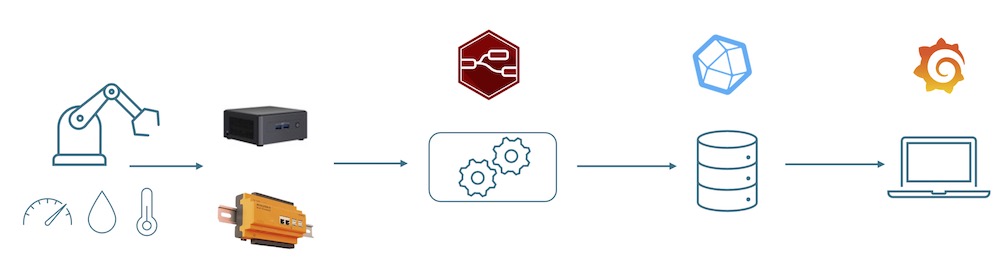
The machine-related CO₂ footprint of a machine includes all CO₂ equivalents generated in connection with the machine. The focus is on dynamic consumables such as energy, coolants and compressed air, although static values, such as emissions from the manufacture of the machine, are also taken into account. For this purpose, a large amount of data relating to the machine is required and is supplemented with estimates and assumptions. The collected data is processed and immediately calculated as CO₂ equivalents, stored and then visualized, enabling real-time monitoring. Figure 1 shows the data flow from the machine via data processing and storage to visualization.
Technical implementation
A central building block on the way to an environmentally friendly production is the result of a holistic life cycle assessment for a specific product—the product carbon footprint. Using an example product made of aluminum from the digital factory, this article examines the technical implementation of the first steps towards a product carbon footprint. The focus here will be on the manufacturing process, i.e. the production carbon footprint, and in particular on a 5-axis machining center that is used for machining.
The consumption values—from energy to material usage—are recorded in real time. Direct measurements are used where available. In other cases, a well-founded estimate is made. The information is then summarized in the Machine Carbon Footprint, which therefore appears as a subset of the Product(-ion) Carbon Footprint.
Data acquisition and sensor technology
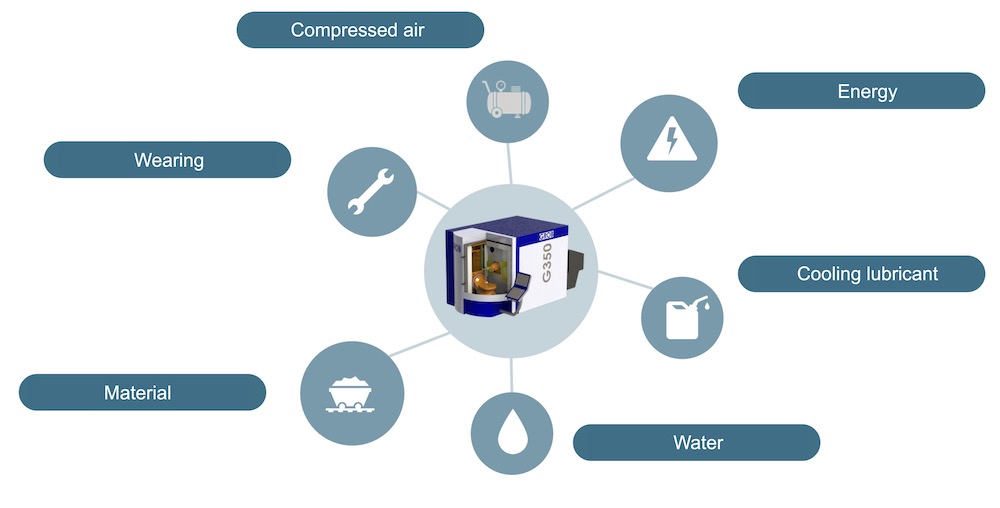
A machining center from Grob is used for real-time consumption monitoring during the production steps. It is equipped with various sensors that record electricity, compressed air, cooling lubricant, and the material used (Fig. 2).
The current is measured using three-phase current clamps from Shelly. These are mainly used on photovoltaic systems in the home automation sector. The technically simple implementation is machine-independent and cost-effective. These sensors inductively record the entire electrical consumption of the machines directly at the power supply. All three phases of the machine are recorded and measured. The power of the machine is measured at a frequency of 1 Hz and also forwarded to the data processing platform with power factors as numerical values.
Emerson flow sensors are used for compressed air monitoring. These sensors work on the basis of a hot-wire anemometer, in which the volume flow is measured indirectly by the flow-induced cooling of a current-carrying wire. Measurement data relating to volume flow, pressure, and temperature are sent as JSON data objects at a frequency of 10 Hz.
Consumption of the cooling lubricant is recorded by a specially developed monitoring system that monitors the temperature and pH value in addition to the fill level of the cooling lubricant tank. The measured values are recorded by temperature sensors, an ultrasonic sensor, as well as a pH sensor and are combined on an ESP32 microcontroller and forwarded as numerical values.
Material consumption is captured using a smart scale. The raw part is weighed before and after processing in order to determine the exact amount of material consumed and the amount of chip waste. Not only is the weight measured, but the material used is also specified to correctly allocate the consumption with the respective emission factors.
Water consumption is not currently measured directly. Instead, an estimate based on the weekly refill quantity is used and extrapolated to the measurement period so that the estimated values can be transmitted in line with the actual consumption data.
The CO₂ emissions caused by the manufacture of the machines are treated similarly. An assumed, fictitious CO₂ value for machine production is estimated based on the weight of the machine and the materials used. The estimated value is then broken down over time using depreciation tables and taken into account on a pro rata basis. An estimate is also made for tool wear. Here, the average service life of the tools is used as a guideline to determine the approximate material consumption. However, as the tools are only used sporadically in the production process, this component is not considered further in this analysis.
All sensors, scales, and monitoring systems send their data to a central MQTT broker in real time via the MQTT protocol at an individually definable interval. Consequently, the information from the various sensors is structured under the respective topics and available for further processing.
Data processing and storage
The MQTT broker is managed by a Node-Red instance that is installed on an industrial PC (IPC). Node-Red acts as a low-code platform and interface for automated data processing [4]. The incoming sensor data is sorted in Node-Red according to its respective MQTT topics and merged into a message object to ensure a uniform and precise database. In addition, the CO₂ equivalents for the measured consumption are calculated by applying the appropriate emission factors to the data and adding them to the message object as additional information.
The message object is then sent to an InfluxDB database. InfluxDB is an open source database specifically optimized for time series data, which allows for efficiently storing and managing large amounts of continuously incoming data. In addition, data points are provided with tags (properties) that enable subsequent filtering and analysis according to certain criteria, such as order numbers [5].
Data visualization
The InfluxDB user interface offers an integrated query builder for an initial visualization of the recorded and processed data. As a result, data queries can be performed without in-depth knowledge of the Flux query language, allowing the database to be understood as a low-code solution. Relevant consumption and CO₂ data can then be clearly displayed and further processed to gain deeper insights into machine performance and machine-related CO₂ consumption.
The collected machine data is visualized using the open source software Grafana, which enables a flexible and customizable display. Grafana supports the integration of various data sources, including InfluxDB, and offers a user-friendly interface to display the stored data clearly and interactively. Once the InfluxDB database is linked to Grafana, the data can be visualized as graphs and dashboards (Fig. 3).
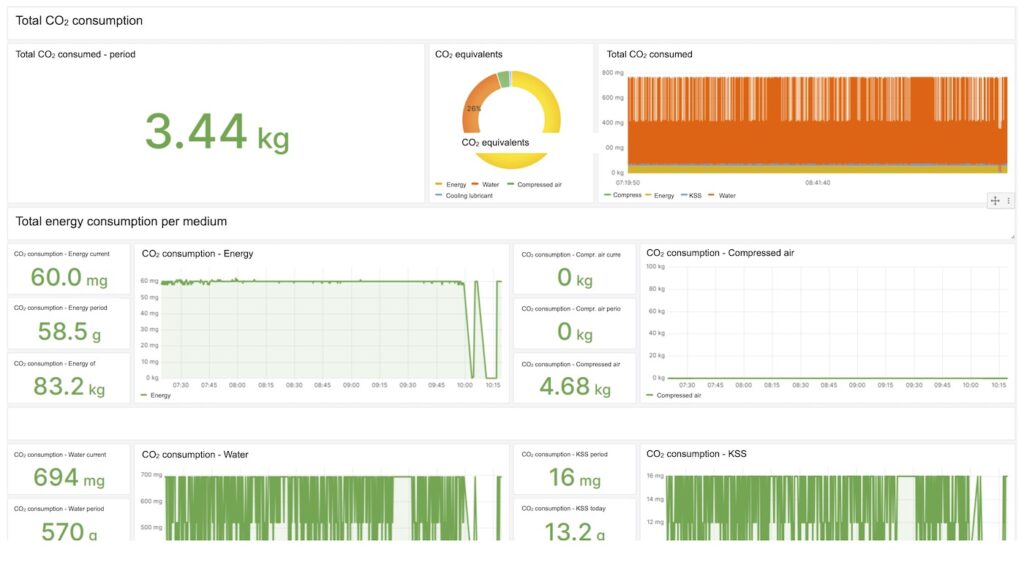
The visualization is realized via Flux queries that access the data stored in the InfluxDB. Thus, each graphic can be individually designed and adapted to display various consumption parameters and CO₂ emissions in real time. In addition, the use of variables within the dashboard enables flexible customization, e.g. to visualize the consumption data of different machines.
Another feature of Grafana is the ability to integrate threshold values and KPIs (Key Performance Indicators) directly into the visualizations. In this way, critical threshold values or targets can be displayed clearly and concisely in the dashboards.
In addition, the consumption data is forwarded to a Grob cloud service so that the consumption data of the resources and CO₂ is visualized in addition to the machine information. This not only enables real-time monitoring of machine data, but also links it directly to the machine’s resource consumption.
Determination of the product carbon footprint
The product carbon footprint can be determined in two ways. Either the product or order number is assigned to each production step, ensuring that all consumption is recorded precisely and assigned directly, or a quantity distribution is carried out in which consumption values are scaled to several manufactured units. For the entire product carbon footprint, the data is divided into two categories: static and dynamic values.
Static values are emission data that cannot be influenced by the production process itself. They relate to all emissions that occur before and after the actual production process, such as those caused by raw material extraction, transportation and disposal. A holistic, detailed lifecycle analysis and research into the relevant emission factors is required to enable precise accounting of these emissions. The same factors, as stored in databases such as ProBas, must be applied to the real reference masses and transportation routes.
One example is the calculation of the CO₂ equivalent for the aluminum used to manufacture the product. Based on the weight of the product, the specific CO₂ equivalent for aluminum production is determined by converting the weight of the product to the reference value of the emission factors (usually per ton) and multiplying it by the corresponding factor.
Dynamic values are the real-time measurement data and can be assigned directly to the respective processing steps. This data is determined either by reference runs or by measuring individual production processes. For the final determination of the CO₂ equivalents, all consumption data, estimates, and assumptions are collected in a spreadsheet or a software tool such as OpenLCA and offset against the respective emission factors.
Finally, all recorded, estimated, and assumed consumption values are added together to calculate the total carbon footprint of the product. The product carbon footprint is therefore a comprehensive representation of the emissions generated over the entire life cycle of the product.
Sample calculation and evaluation
For an example product made of aluminum, an adhesive tape dispenser, the CO₂ footprint over the entire life cycle is around 4.7 kg CO₂. Assuming that non-recycled aluminum was used, the largest sources of emissions are the extraction of the aluminum used for production, which accounts for 40% of the total value. The production of the unwinder itself accounts for around 30% of emissions. The remaining 30% is divided between transportation, use and recycling of the product. A look at production shows that electricity consumption accounts for 55% and compressed air for 44% of the carbon footprint. The calculation results are summarized in Figure 4.
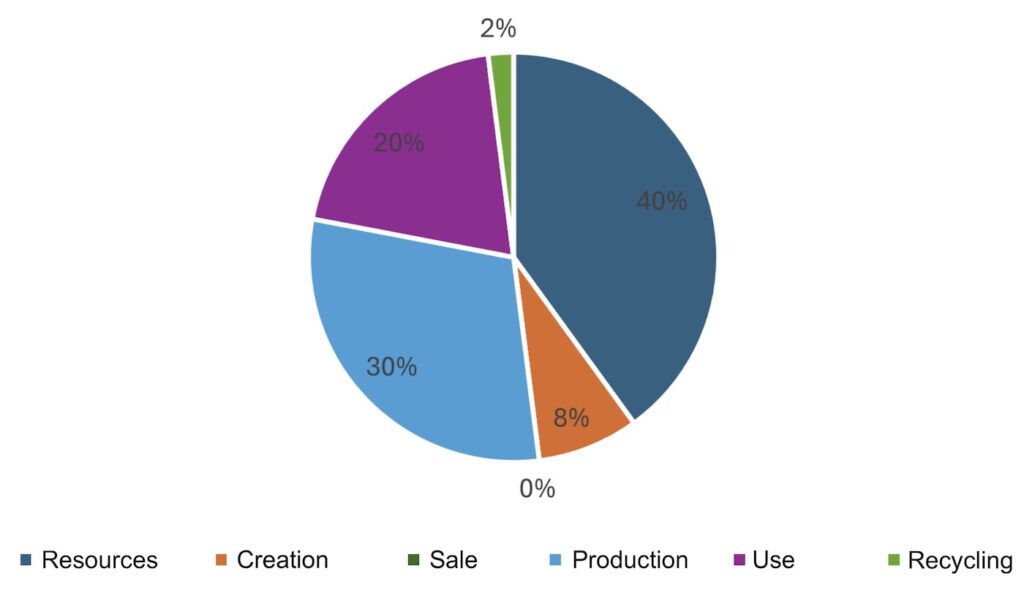
The product example shows that the greatest savings potential lies primarily in the choice of raw materials and in production itself. In production, the percentages show that optimizing the use of energy is a key lever for reducing the carbon footprint. The use of sustainably generated electricity saves 19% of emissions, as this type of electricity generally has an emission factor of zero. However, the choice of raw materials has a much greater impact on the carbon footprint. The use of recycled aluminum significantly reduces the footprint, as recycled aluminum only requires around 5% of the energy needed in primary production [6]. This in turn leads to a reduction in the overall footprint of up to 38%.
The results indicate that switching to more environmentally friendly materials and energy sources can have a significant impact on reducing the carbon footprint. It can also provide a basis for strategic decisions to reduce greenhouse gas emissions.
Benefits and challenges for companies
The introduction of a machine carbon footprint allows SMEs in particular to record energy and resource consumption in real time and precisely quantify CO₂ emissions. With commercially available sensor technology, open interfaces, and low-code solutions, this can be achieved cost-effectively, flexibly, and independently of the machine manufacturer. On this basis, optimization potential can be identified, emissions can be reduced in a targeted manner, and resource efficiency can be increased. The MCF also makes it easier to comply with regulatory requirements, such as those stipulated by the CSRD Directive and the EU Green Deal, and increases transparency along the supply chain.
Another advantage and challenge is the possibility of connecting to existing MES and ERP systems, allowing CO₂ data to be automatically assigned to orders or products and facilitating the integration into existing production and reporting systems. Other challenges include the technical integration of sensors as well as ensuring data quality, particularly when combining real data and estimated values. In organizational terms, a lack of resources or digital skills will likely discourage project initiation. In addition, there is currently a lack of binding standards for evaluating and comparing machine-related emissions.
The approach presented demonstrates that building a reliable CO₂ database can be achieved using simple means. This database serves as a starting point for strategic decisions, continuous process optimization, and sustainable production. Companies that focus on digital sustainability at an early stage not only improve their environmental footprint, but also their own competitiveness.
Bibliography
[1] “The impact of CSRD on companies: A comprehensive overview”, Engel & Zimmermann. Accessed: August 23, 2024 [Online]. Available at: https://engel-zimmermann.de/blog/die-auswirkungen-der-csrd-auf-unternehmen/[2] claudiawiggenbroeker, “Carbon accounting: requirements in business practice”, Transforming Economies. Accessed: April 23, 2025 [Online]. Available at: https://transforming-economies.de/co2-bilanzierung-anforderungen-in-der-unternehmenspraxis/
[3] O. Eisele, “CO2-Bilanzierung. A review of the current situation in corporate practice”, [Online]. Available at: https://www.arbeitswissenschaft.net/fileadmin/Downloads/Angebote_und_Produkte/Broschueren/ifaa_CO2_Bilanzierung_5_final.pdf
[4] “Low-code programming for event-driven applications : Node-RED”. Accessed March 7, 2025 [Online]. Available at: https://nodered.org/
[5] “InfluxDB key concepts | InfluxDB OSS v1 Documentation”. Accessed February 4, 2025 [Online]. Available at: https://docs.influxdata.com/influxdb/v1/concepts/key_concepts/
[6] H. Frischenschlager et al, “KLIMARELEVANZ AUSGEWÄHLTER RECYCLING-PROZESSE IN ÖSTERREICH”.
Potentials: Resource Efficiency