Safeguarding Against Risks in the Wire Arc Additive Manufacturing Process |
| Journal | Industry 4.0 Science |
| Issue | Volume 40, 2024, Edition 1, Pages 63-69 |
| Open Access | https://doi.org/10.30844/I4SE.24.1.63 |
| Bibliography | Share | Cite | Download |
Abstract
Keywords
Article
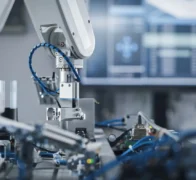
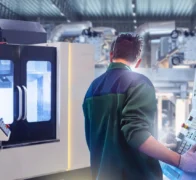
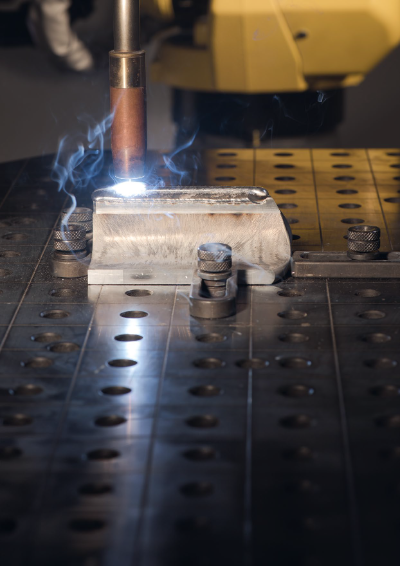
Additive manufacturing (AM) is an emerging field of manufacturing processes. One of these processes is wire arc additive manufacturing (WAAM). This is based on arc welding processes. Compared to other processes, these offer the advantages of cost-effective system technology and high production outputs of up to ten kilograms per hour [1]. The WAAM process is used for rapid prototyping, rapid tooling, direct manufacturing and additive repair [2].
Despite many years of experience with deposition welding processes, fully additively manufactured components are still considered critical due to unstable processes [3]. This is due to various influences such as welding parameters, interpass temperature and heat input. In Issue 5/2023 of this German-language magazine and in the special 2023 English edition, Fischer et al. modeled these influences using the Structured Analysis and Design Technique (SADT) and made a contribution to improving component quality [4]. The aim of the current article is to evaluate this modeled process to determine specific optimization potential using failure mode and effects analysis (FMEA).
The FMEA method
FMEA is a systematic, group-oriented and qualitative analysis method. The procedure aims to assess the technical risks of a product or process defect, investigate the causes and consequences of these potential hazards, document planned and implemented prevention and detection measures and recommend sensible risk minimization actions [5].
A Process FMEA (PFMEA) is used in this work. In principle, a PFMEA can be divided into the following seven steps [5]: Planning and preparation, structural analysis, functional analysis, failure analysis, risk analysis, optimization and documentation.
Planning and preparation consists of defining the scope and the project plan. Furthermore, analysis limits are set and possible basic FMEAs are used to create a foundation. Ultimately, this step entails laying a foundation for the structural analysis [5].
In the structural analysis step, the manufacturing system is identified and broken down into consequence level, function level and cause level. The main objective is to create a process flow diagram in conjunction with the identification of the process steps and their sub-steps [5].
The purpose of the functional analysis is to ensure that the defined requirements of the process are correctly assigned. The aim is to visualize and then assign the requirements to the functions [5].
The benefit of failure analysis is the identification of the consequences, types and causes of errors. In addition, the presentation of their relationships is of great importance for risk assessment. The objectives of this step are to recreate the error sequence chains and to identify the cause of the process error [5].
In the risk analysis, the risk of failure is estimated for each element of the failure sequence chain (failure type, cause and consequence). These factors are evaluated using the following three criteria [5]: Significance (S), Probability of Occurrence (O) and Probability of Detection (D).
S describes the significance of the most serious error sequence. O indicates the frequency of occurrence of the cause of the error in the process, considering the current prevention measure. D refers to the capability or degree of maturity of the detection method and the possibility of detection [5].
All criteria are assessed within the risk analysis process with a rating system that ranges from one to ten. A high rating indicates a high risk. After the assessment, the criteria are multiplied. The resulting product is referred to as the risk priority number (RPN) and serves as the basis for prioritizing the need for action. The RPN can have values between one and 1,000 [5].
In the risk matrix, these are divided into three different categories. The first is the low priority of action. In this area, it is up to the FMEA team to identify further actions that improve the prevention or detection actions. In the medium and high priority categories, the team should or must define appropriate actions to improve occurrence and/or detection rates. In exceptional cases, it is sufficient to justify and document the sufficiency of the actions taken [5, 6].
Optimization is the penultimate step of the PFMEA. It serves to define risk reduction actions and evaluate their effectiveness. The aim of this step should be to define and schedule the responsibilities of the actions taken [5].
The final step is result documentation. This includes the implementation of the actions taken and confirmation of their effectiveness. Furthermore, the risk is reassessed after the actions have been implemented [5].
The result, after going through the described steps, is a process that poses minimal risk for the creation of a product [5].
Results – identification of risks
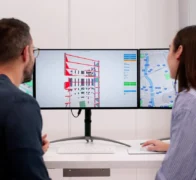
In accordance with the specifications, the PFMEA was carried out in an interdisciplinary team [5]. Version 7.0 of the FMEA software from APIS Informationstechnologie GmbH was used for processing [7].
For this purpose, the structural analysis is based on the work of Fischer et al. in which the process is divided into six steps [4]. After consultation with the FMEA core team, these steps are renamed slightly to make them easier to understand. This results in the following process steps: design component, design path layout, adapt welding parameters to the specific component, manufacturing, post-processing and testing.
At the root cause level, the FMEA team follows the Ishikawa or “6M” method in accordance with the recommendations of the Automotive Industry Action Group and Verband der Automobilindustrie (AIAG/VDA) manual. The six “M” stand for the possible cause categories of machine, measurement, material, manpower, method and mother nature (environment) [5, 8]. Figure 1 shows an example of the structure of the first step “Design component”.

In the third step, the FMEA team defined a total of 76 functions or characteristics under the categories. The next step was the failure analysis, in which 186 possible causes of failure were determined. These causes of failure are then linked to previously identified failure modes and to the consequences they will have on the end product.
The fifth step was the risk analysis. For this purpose, an assessment catalog must first be defined. In this respect, the team followed the guidelines in the AIAG/VDA manual. The only deviations are in the formulation of the functions and the failure consequences in relation to the final component. These are shown in Figure 2.

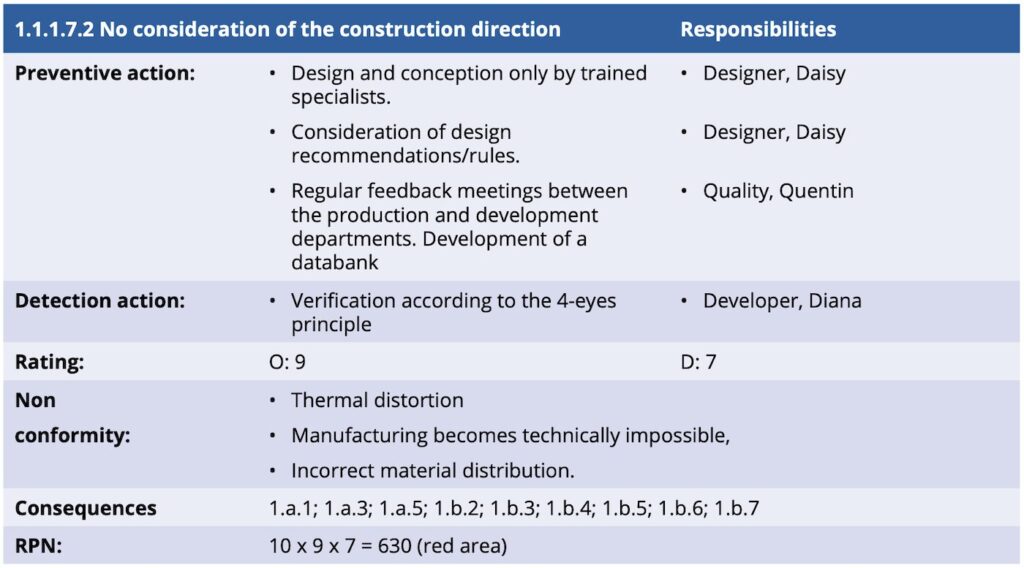
The risk priority numbers for each individual process step are calculated according to the links. These are reduced in the subsequent step by defining prevention and detection actions. Figure 3 illustrates this step in detail using the example of the most critical cause of failure “1.1.1.7.2 No consideration of the construction direction”.
Following this procedure, all 186 recorded causes of failure were evaluated. Based on this assessment, the risk is screened using the risk matrix. This matrix is shown in Figure 4.

The distribution of risks shows an accumulation in the yellow area, with 89 risk causes. Causes in the yellow area are accepted by the FMEA team. This is followed by 52 possible causes of failure in the green zone, for which no actions need to be taken, and 45 risk causes in the red zone. Of these, 36 are bordering the yellow zone.
This following will first discuss the five most critical risk causes in Figure 5, which are prioritized as follows:
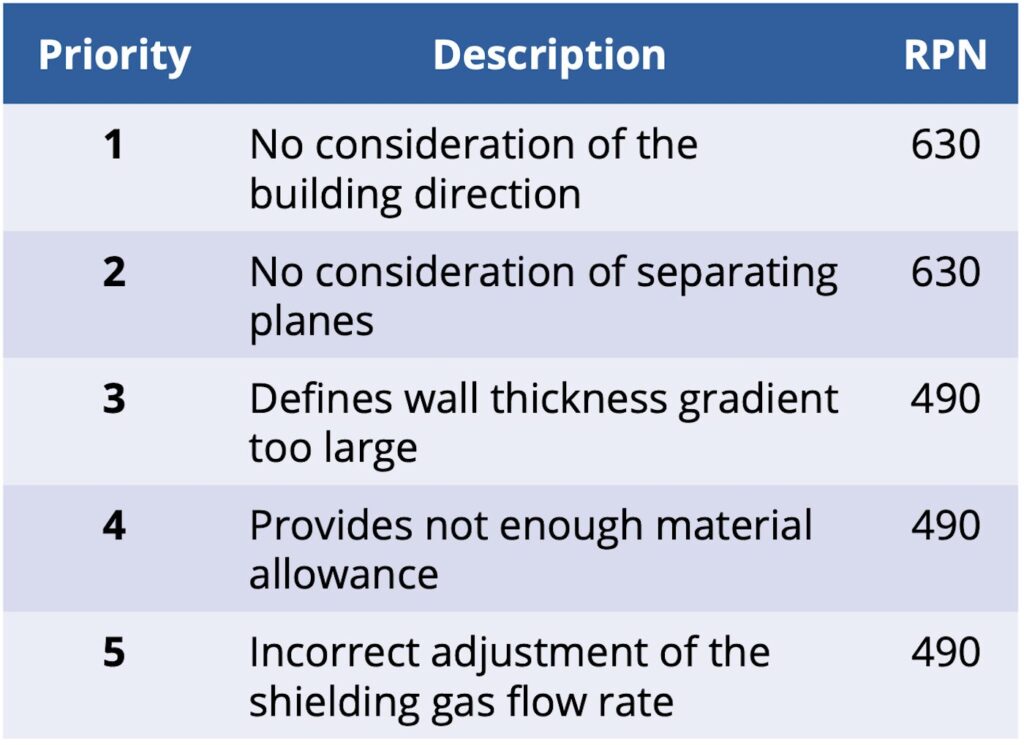
It is clear that risk causes one and two, as well as three to five, have an identical RPN. Prioritization in this regard is based on the process flow. The earlier the respective cause of failure could occur, the higher the prioritization. The results of the FMEA show that the first four risk causes relate to the process step of component design and construction. Consequently, there is a recommendation for the internal definition of clear design and construction guidelines for additive components.
The basis for this can be [9]. In addition, it is recommended that the results of the individual process steps are documented, to set up an internal knowledge database which is regularly reviewed and updated.
The fifth greatest potential risk in the present elaboration results from the incorrect adjustment of the shielding gas flow rate. This influence, for example, the cooling rate or viscosity of the melt and thus the weld bead geometry and microstructure properties. However, it is not suitable to consider these parameters separately from the other welding parameters due to existing interactions. Figure 6 shows the influences of the welding parameters in an Ishikawa diagram [10].
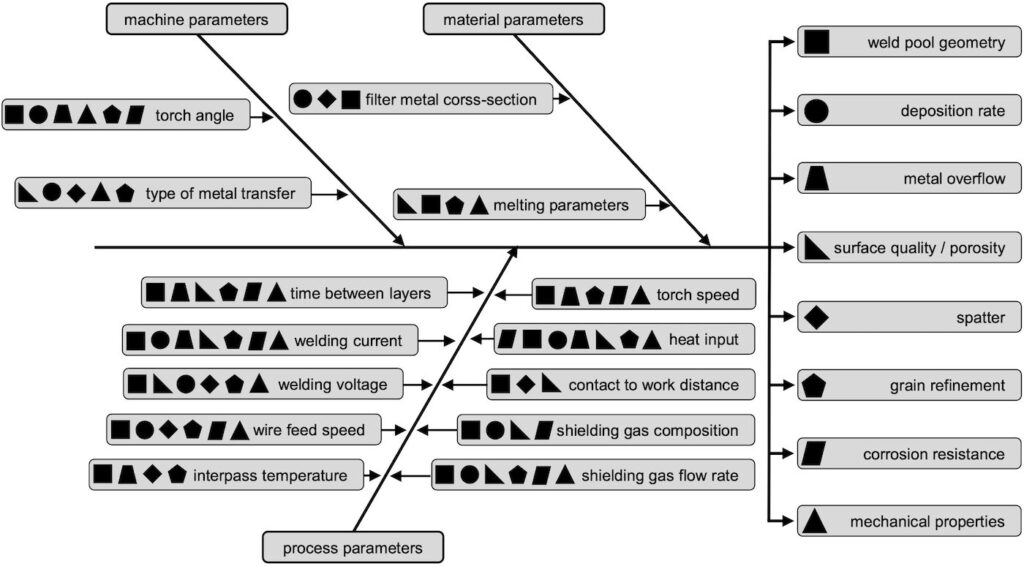
The image illustrates the complexity of the factors that influence the welding result. In the short term, this risk can be compensated for by specifying fixed parameters and increasing the allowance. In the long term, the aim should be to fully determine the correlations. For this purpose, it is necessary to carry out numerous tests. Design and construction should be supported with the help of machine learning methods in the future. Initial investigations show the potential of this approach for individual steel [11] and stainless-steel materials [12].
Conclusion – machine learning approaches will have an advantage in future
This paper used the FMEA method to provide an initial overview of the main risks in the WAAM process. It became clear that the causes of risk are often already located in the component design and construction. Furthermore, the welding parameters have a major influence on the process result. These are subject to strong interactions, which cannot be mapped using the FMEA methodology. In the future, machine learning approaches can support the determination of influences and the consideration of interactions. In addition, the current draft of the FMEA should be regularly revised as knowledge increases.
Bibliography
[1] Williams, S. W.; Martina, F.; Addison, A. C.; Ding, J.; Pardal, G.; Colegrove, P.: Wire + Arc Additive Manufacturing. In: Materials Science and Technology 32 (2016) 7, S. 641-647.[2] Lachmayer, R.; Lippert, R. B.: Grundlagen. In: Lachmayer, R.; Lippert, R. B. (Hrsg): Entwicklungsmethodik für die Additive Fertigung. Berlin Heidelberg 2020, S. 7-20.
[3] Seifi, M.; Salem, A.; Beuth, J.; Harrysson, O.; Lewandowski, J. J.: Overview of Materials Qualification Needs for Metal Additive Manufacturing. In: JOM 68 (2016) 3, S. 747-764.
[4] Fischer, T. S.; Grüger, L.; Woll, R.: Modellierung von Einflüssen auf das Wire Arc Additive Manufacturing. In: Industrie 4.0 Management 2023 (2023) 5, S. 53-57.
[5] Automotive Industry Action Group; Verband der Automobilin- dustrie: FMEA-Handbuch. Fehlermöglichkeits- und Einflussanalyse/Design FMEA/Prozess FMEA/FMEA-Ergänzung/Monitoring & Systemreaktion. Berlin 2019.
[6] Rohrschneider, U.: Risikomanagement in Projekten. Die häufigsten Fallen und Gefahren – Die besten Sofortmaßnahmen. Freiburg Berlin München 2006.
[7] APIS Informationstechnologien GmbH: IQ-FMEA. APIS Informa- tionstechnologien GmbH (2023).
[8] Stoesser, K. R.: Ausgewählte Methoden, Tools und Vorgehens- weisen. In: Stoesser, K. R. (Hrsg): Prozessoptimierung für produzierende Unternehmen. Wiesbaden 2019, S. 45-109.
[9] Lachmayer, R.; Lippert, R. B. (Hrsg): Entwicklungsmethodik für die Additive Fertigung. Berlin Heidelberg 2020.
[10] Pattanayak, S.; Sahoo, S. K.: Gas metal arc welding based addi- tive manufacturing—a review. CIRP Journal of Manufacturing Science and Technology 33 (2021), S. 398-442.
[11] Venkata Rao, K.; Parimi, S.; Suvarna Raju, L.; Suresh, G.: Modelling and optimization of weld bead geometry in robotic gas metal arc-based additive manufacturing using machine learning, finite-element modelling and graph theory and matrix approach. In: Soft Computing 26 (2022) 7, S. 3385-3399.
[12] Xiao, X.; Waddell, C.; Hamilton, C.; Xiao, H.: Quality Prediction and Control in Wire Arc Additive Manufacturing via Novel Machine Learning Framework. In: Micromachines 13 (2022) 1, S. 1-15.