
Data-Driven Supplier Selection in Industry 4.0 |
Towards an industrial platform for selection and configuration

| Journal | Industry 4.0 Science |
| Issue | Volume 42, 2026, Edition 4, Pages 50-61 |
| Open Access | https://doi.org/10.30844/I4SE.26.4.6 |
| Bibliography | Share | Cite | Download |
Abstract
Keywords
Article
Industrial supply chains operate under frequent disturbances and shifting boundary conditions, including demand swings, transport variability, and supplier-side disruptions [1-3]. These conditions force procurement organizations to revisit sourcing choices frequently under shorter decision windows [4, 5]. At the same time, the information needed to make and justify such revisions is often scattered across supplier documents, online portals, and proprietary information systems [6, 7]. Capability descriptions differ in vocabulary, structure, and granularity, which makes suppliers hard to compare and increases the risk that decisions are neither reproducible nor easily updated when conditions change [8].
Research provides models for supplier selection, supply network design, and simulation-based evaluation of sourcing alternatives [9, 10]. In parallel, the information systems literature explains persistent interoperability problems: supplier data is stored in heterogeneous formats, described with different terminologies, and distributed across ERP systems, supplier portals, spreadsheets, and engineering tools [11, 12].
In industrial sourcing, supplier selection is also constrained by the supplier’s ability to integrate seamlessly into the customer’s digital engineering toolchain (e.g., PLM/PDM–CAD–CAE). Efficient exchange of 3D models, PMI/MBD information, and coordinated change management across organizational boundaries is essential for co-engineering and ramp-up, yet is often handled through manual file transfer and non-standardized interfaces.
This separation creates two technical problems. Initially, it increases integration effort because models assume structured and comparable input data that rarely exists in that form [13, 14]. Furthermore, it weakens traceability: the link between an initial requirement (e.g., a process capability or sustainability threshold), the shortlist of candidates, the performance estimates, and the final configuration decision is not preserved in a unified representation [15].
The challenge becomes particularly salient when procurement must enforce multi-criteria constraints (such as carbon intensity limits alongside cost, lead time, and reliability) because inconsistent data semantics make it difficult to verify how constraints were operationalized and whether they were applied consistently across decision stages [16, 17]. These problems motivate the central research question of this work:
How can a procurement platform integrate semantic supplier discovery, quantitative performance evaluation, and configuration decisions into a single, coherent workflow?
To answer this question, we develop a framework for a data-driven industrial platform that connects the following three elements:
- Supplier information is represented through machine-readable profiles based on the Asset Administration Shell (AAS) [18].
- An Actor-Service ontology separates organizational identity and contractual context from technical capabilities and operational constraints, thereby structuring supplier data in a way that supports both comparison and analysis.
- Pre-defined KPIs translate evaluation results systematically into configuration objectives and constraints.
First, research on supplier selection and supply chain configuration is reviewed in order to identify the representation and workflow gaps that emerge when these models are embedded in platform settings. The proposed architecture is then introduced alongside an explanation of how interoperable supplier profiles, simulation-based evaluation, and KPI-based configuration jointly address these gaps.
State of the art
Supply chain configuration refers to the structural design or adaptation of a supply network. It specifies which actors are included, how they are connected, and how products and services are allocated across tiers and transportation routes [19].
In procurement-driven contexts, configuration decisions are largely determined by supplier selection. Firms must decide which suppliers are eligible for a given set of items or services and how sourcing strategies, such as single, dual, or multiple sourcing, affect redundancy, dependency, and risk exposure in the resulting network structure [20, 21].
Existing literature formalizes supplier selection as a combinatorial optimization problem [22-24]. To reflect real-world uncertainty, these models are frequently extended through stochastic optimization approaches, scenario-based formulations, and probabilistic (chance) constraints [16, 21].
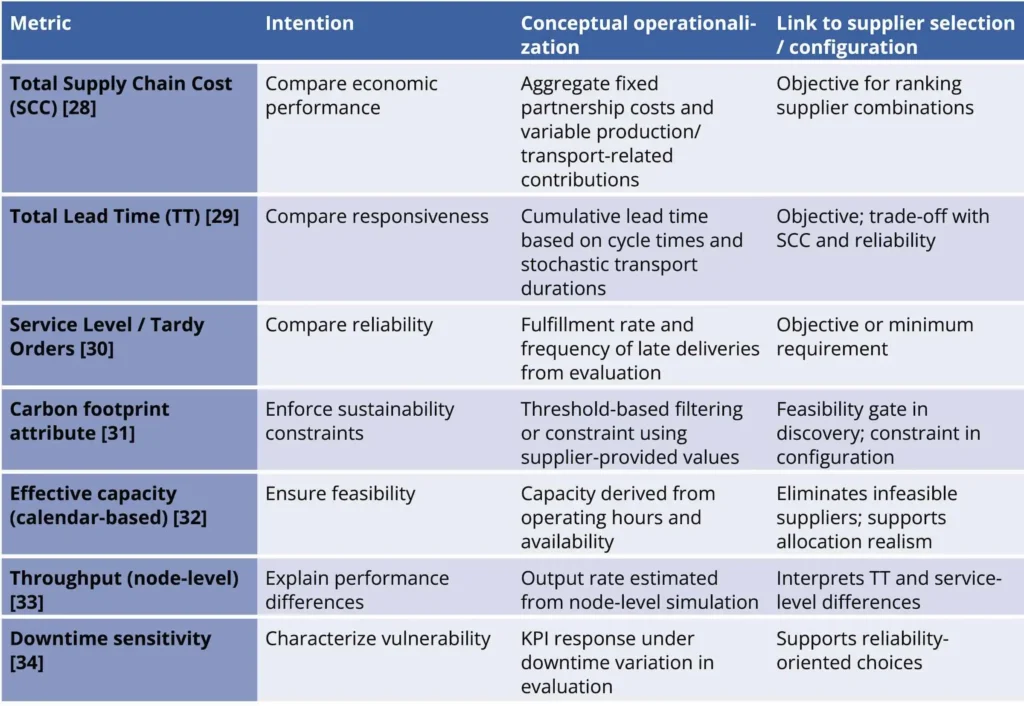
In procurement-driven supply chain configuration, decisions are typically guided by a set of recurring performance dimensions: economic efficiency, responsiveness, reliability, feasibility, and sustainability. These dimensions must be translated into measurable indicators that can be computed during evaluation and subsequently used as objectives or constraints in configuration problems [25-27].
In Figure 1, we specify the KPIs used in this work and clarify their role in linking evaluation results to supplier selection and network configuration decisions.
System architecture
Industrial procurement faces three interconnected challenges when reconfiguring supply chains:
- Supplier capability information exists in fragmented, non-standardized formats.
- Detailed operational data required for performance evaluation is rarely available in a structured form
- Simulation outputs rarely feed into configuration decisions through a traceable link.
The proposed architecture addresses these challenges through an integrated three-module system (Fig. 2). Module 1 transforms heterogeneous supplier descriptions into standardized, machine-readable profiles that enable capability matching. Module 2 converts structured supplier data into discrete-event simulation models for performance evaluation. Module 3 uses a consistent KPI interface to formulate and solve supplier selection problems using mathematical optimization or metaheuristic algorithms.
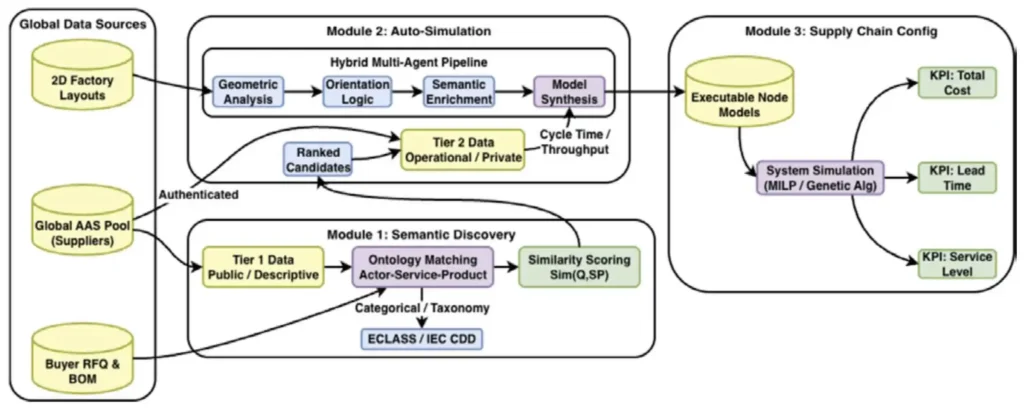
Module 1: Semantic supplier discovery
Traditional approaches to supplier discovery rely on manual search through supplier directories, databases, or company websites, where buyers filter candidates using basic keyword matching on company names, locations, or capability descriptions [35]. This approach faces several limitations in complex industrial procurement contexts. Terminology varies significantly across companies and sub-sectors—one supplier may describe a capability as “precision machining” while another uses “tight-tolerance manufacturing” for the same service. Furthermore, keyword searches cannot capture semantic relationships; searching for “CNC milling” will miss suppliers listing “5-axis machining” even though it represents a more specific capability.
Module 1 replaces keyword-based discovery with an ontology-driven approach that matches suppliers based on the meaning of their capabilities, not just the words used to describe them. The architecture adopts the Asset Administration Shell (AAS) standard [36] as the foundation for digital supplier representation. Although the AAS was originally developed to digitize manufacturing resources in Industry 4.0 contexts [37], its use here is driven by three key factors that enable semantic discovery:
- Pre-defined submodels for technical specifications and organizational information align well with supplier profile requirements.
- Semantic identifiers (IRDIs/IRIs) enable unambiguous, machine-readable capability descriptions.
- Suppliers who have already digitized their production facilities can export relevant information into supplier profiles with minimal additional effort [38].
Beyond semantic discovery, AAS-based supplier profiles can act as a stable integration layer for customer toolchains by exposing standardized endpoints and supported exchange formats (e.g., neutral CAD/3D formats and associated metadata). This enables the interoperable handover of engineering artifacts and reduces friction in supplier onboarding and co-engineering workflows [39-41].
The Actor-Service ontological framework
The platform structures supplier profile data into two ontological domains: Actor and Service [42]. The Actor class captures stable organizational characteristics—company identity, legal designation, geographic location, industry classifications (e.g., NACE codes), and commercial context—that provide the basis for evaluating supplier reliability, proximity, and strategic fit. The Service class defines dynamic technical capabilities and operational parameters—process classifications (e.g., ECLASS codes), precision specifications, material compatibility, production volume constraints, lead time ranges, and environmental metrics such as carbon footprint—that may evolve as suppliers add equipment or modify processes.
Together, both domains contribute to a composite similarity score that ranks candidates according to buyer-defined priorities. The separation also serves the downstream modules: Actor data informs network topology and location constraints in Module 3, while Service data provides the technical parameters required for simulation model generation in Module 2.
The two tiers
Within the Actor-Service framework, the platform implements a two-tier data structure that addresses a fundamental tension in supplier discovery: buyers need detailed information to make informed decisions, but suppliers are reluctant to publicly disclose operational details that could reveal competitive advantages or be exploited by competitors. The term ‘tier’ here refers to data access levels: Tier 1 is publicly accessible, while Tier 2 is restricted to authenticated buyers.
Tier 1 provides the information needed for initial supplier filtering using standardized, non-sensitive data that suppliers typically disclose publicly. Every data element in Tier 1 is mapped to standardized semantic identifiers (IRDIs/IRIs) from industrial classification systems such as ECLASS or IEC CDD, eliminating terminology ambiguity across languages and company-specific descriptions. For example, the ECLASS identifier ‘0173-1#02-ABG776#003’ is a standardized code assigned to a specific machining process within the ECLASS classification hierarchy. Any supplier profile that references this identifier—regardless of whether they describe the process in English, German, or French—is retrieved by the same query, eliminating language and terminology barriers. Figure 3 details the Tier 1 profile structure.
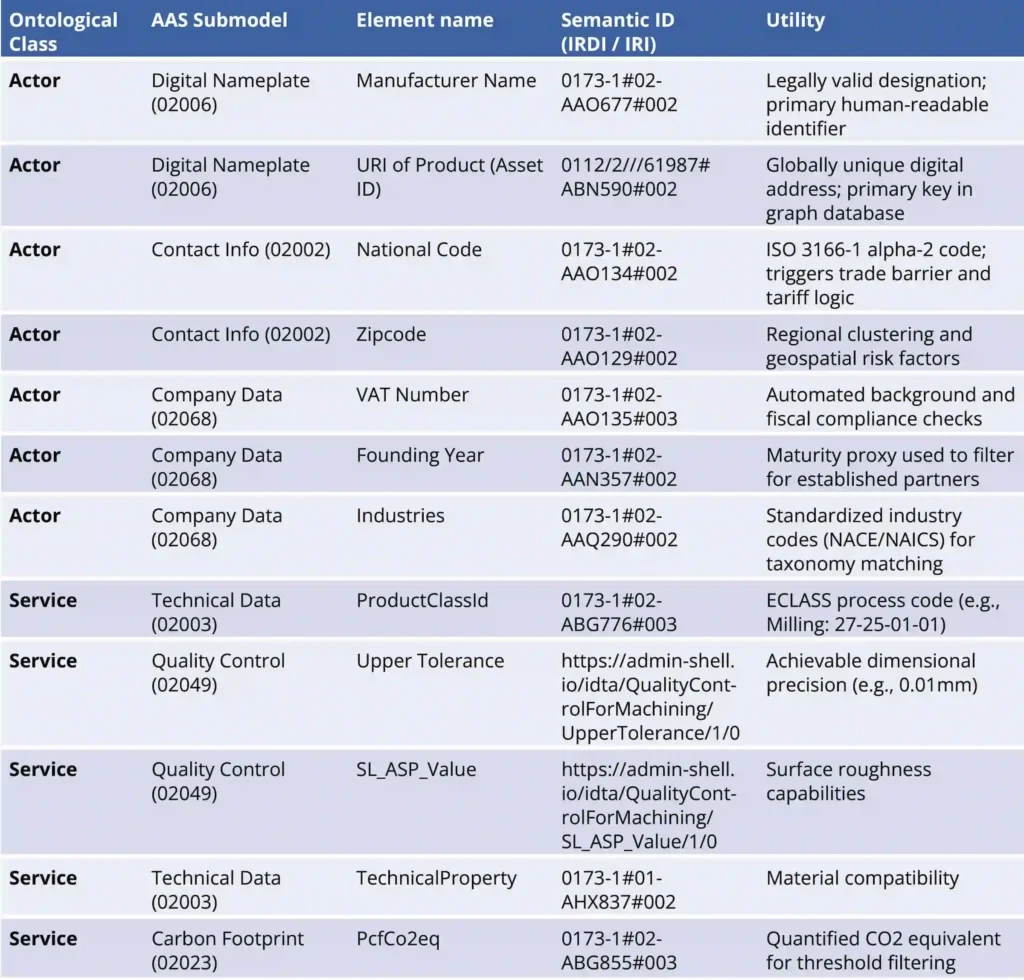
In summary, Tier 1 filtering operates across two dimensions. Industry classifications and process types are evaluated using taxonomy-based similarity, capturing semantic relationships between related capabilities. Technical capabilities such as material compatibility, surface roughness, tolerance, and carbon footprint are compared using feature-based similarity, with hard numerical thresholds for surface roughness, tolerance, and carbon footprint eliminating non-compliant suppliers outright. Together, these mechanisms reduce a potentially large supplier pool to a qualified shortlist that proceeds to detailed evaluation.
Tier 2 provides the detailed computational parameters required for automated simulation model generation (Module 2), accessible only to authenticated buyers who have passed Tier 1 screening. Tier 2 data is structured using specialized AAS submodels: Hierarchical Structures (02011) maps the supplier’s factory floor topology and production station connectivity; Production Calendar (02067) captures temporal operating constraints such as shift schedules and maintenance windows; and Purchase Order (02050) provides commercial boundary conditions including pricing structures and lead times. Tier 2 additionally includes facility layout data describing equipment capabilities, processing times, and buffer capacities. Figure 4 summarizes the Tier 2 structure.
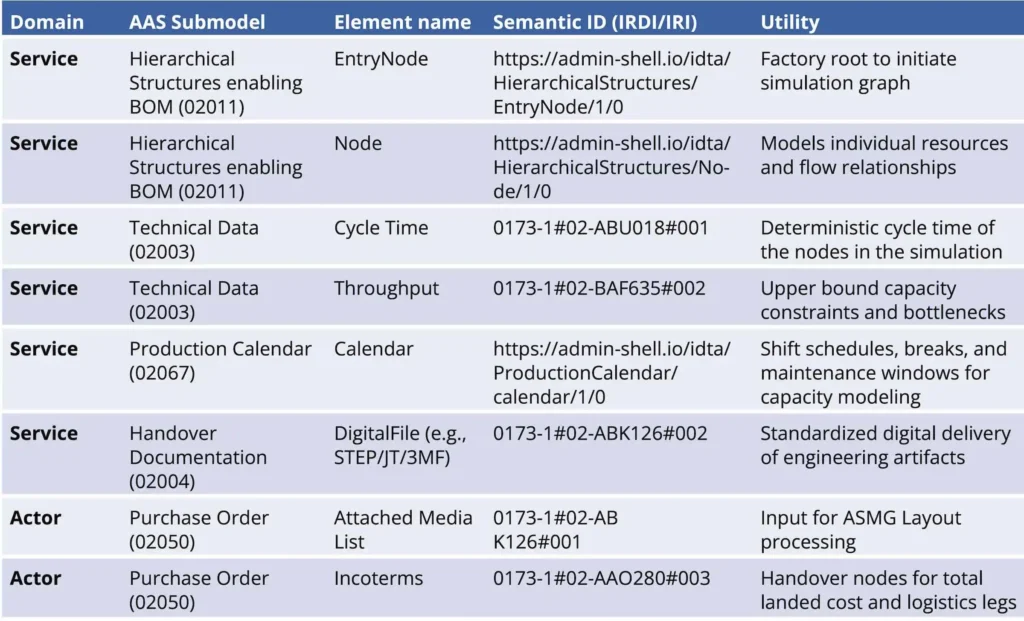
Tier 2 parameters transform static capability descriptions into dynamic models that can predict supplier performance under varying scenarios. While Tier 1 indicates whether a supplier possesses a required capability, Tier 2 reveals how that capability performs in practice—whether it is constrained by production bottlenecks or limited by shift schedules. This distinction is crucial for accurate lead time projections and delivery reliability estimates.
Once semantic filtering has narrowed the candidate pool to a qualified shortlist, the system ranks suppliers by calculating a global similarity score for each supplier—a single number between 0 and 1 reflecting how closely a supplier matches the buyer’s requirements. This score is a weighted combination of how well the supplier matches across the Actor and Service domains [43]:

Where is the buyer’s query,
is the supplier profile, and
and
are buyer-defined weights reflecting whether organizational fit or technical capability is prioritized.
The similarity within each domain is calculated differently depending on the nature of the data. Taxonomy-based similarity is used for hierarchically structured classifications such as industry codes and process types from ECLASS. Rather than requiring an exact match, the system measures how closely related two concepts are within the taxonomy by identifying their Lowest Common Ancestor (LCA) —the most specific concept that subsumes both. A buyer querying for “automotive stamping” will still match a supplier offering “sheet metal forming” because both share a close common ancestor in the ECLASS hierarchy. The similarity is quantified using Lin similarity [43]:

Where ,
measures concept specificity based on how frequently concept
appears across registered supplier profiles [44]. Concepts appearing rarely in the supplier pool carry high information content, meaning that two suppliers sharing a rare, specialized capability receive a higher similarity score than two suppliers sharing a broad, common one.
Feature-based similarity is used for technical capability sets such as material compatibility and offered processes. The system compares the set of capabilities required by the buyer against those offered by the supplier using the Jaccard Index [45]:
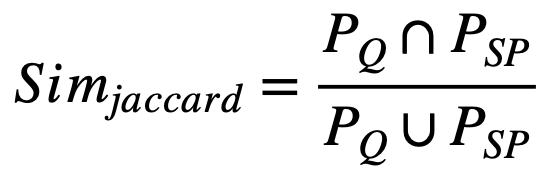
A supplier offering exactly the requested set of materials or processes scores 1.0, while a supplier with partial overlap scores proportionally lower.
Hard constraint filtering is applied to numerical specifications such as achievable tolerances, surface roughness, and carbon footprint. If a supplier’s value falls outside the buyer’s required threshold, that component is set to zero, removing the supplier from the shortlist regardless of performance elsewhere.
The final score combines all these evaluations across both domains, producing a ranked list where the highest-scoring suppliers proceed to Module 2 for detailed simulation-based evaluation.
Module 2: Automatic simulation model generation (ASMG)
Static capability descriptions from Tier 1 profiles indicate whether suppliers possess the required capabilities, but they cannot predict actual operational performance under realistic conditions. Bottlenecks, shift schedules, equipment downtime, and capacity constraints significantly affect achievable lead times and delivery reliability.
Module 2 addresses this limitation by generating executable discrete-event simulation models that quantify how supplier-specific operational characteristics impact real-world performance. The module uses high-fidelity Tier 2 data from AAS profiles and visual facility layouts to generate dynamic supplier performance projections, enabling buyers to evaluate facility-level behavior without requiring specialized simulation expertise.
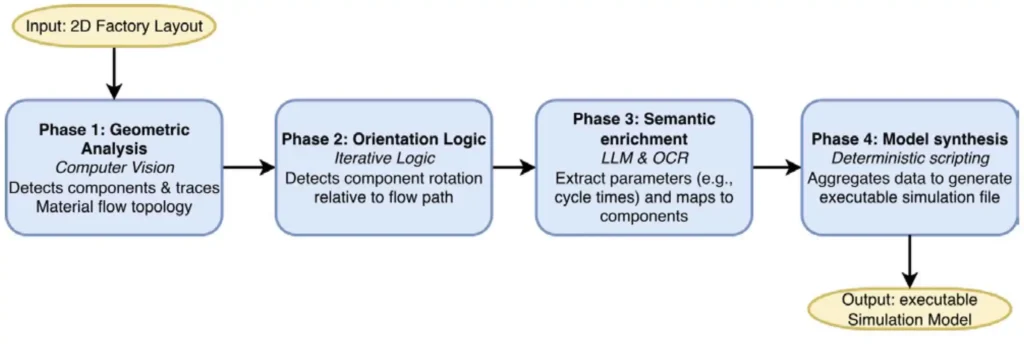
Module 2’s technical core is a hybrid multi-agent architecture that semantically parses 2D facility layouts by integrating large language models (LLMs) with deterministic computer vision to interpret spatial relationships and material flow directions. The pipeline decomposes visual interpretation into four phases as illustrated in Figure 5.
The simulation model is enhanced by direct injection of node-specific parameters from the supplier’s AAS Tier 2 profile, mapped via semantic identifiers to eliminate manual parameter entry or LLM-based estimation. Specifically, the cycle time attribute from the hierarchical structures submodel defines deterministic processing durations for each production station, while buffer capacity parameters establish queue limits and throughput constraints.
The Production Calendar submodel (AAS 02067) provides temporal operating constraints including shift schedules, planned breaks, and maintenance windows, enabling accurate modeling of effective capacity based on actual working hours rather than theoretical 24/7 operation. Delivery lead time attributes from the purchase order submodel (AAS 02050) additionally provide temporal boundary conditions for schedule adherence evaluation.
A proof-of-concept prototype of the ASMG module was implemented and validated on a representative U-shaped manufacturing layout featuring parallel processing stations and multi-directional recirculation loops. The hybrid multi-agent pipeline achieved a 90% success rate across 30 repeated runs, generating fully functional, parameter-enriched discrete-event simulation models in Siemens Plant Simulation.
The automated approach reduced model generation time from approximately 60 minutes (manual expert construction) to approximately 5 minutes, and cost from €50 to €0.23 per model, representing a 92% time reduction and 99% cost reduction. Minor connection-logic errors occurred in 6.7% of runs and were manually correctable within minutes; only 3.3% of runs resulted in critical failure. These results indicate reliability suitable for practical industrial deployment [46].
Module 3: Supply chain configuration and optimization
Module 1 identifies technically qualified suppliers and Module 2 quantifies their individual operational performance. However, procurement decisions must evaluate supplier combinations rather than individual suppliers in isolation. Different sourcing strategies—such as single-sourcing from one supplier versus dual-sourcing from two geographically dispersed suppliers—create fundamentally different supply chain structures with distinct risk-cost-speed trade-offs. Module 3 addresses this system-level configuration challenge by evaluating how different supplier combinations perform across multiple objectives and constraints.
The optimization process combines node-specific performance parameters from Module 2 with buyer requirements, including bill of materials dependencies, logistics parameters (transportation modes, lead times, Incoterms), geographic distances affecting cost and environmental impact, and temporal constraints such as delivery deadlines.
The computational logic uses iterative simulations or mathematical optimizations, often employing MILP or Genetic Algorithms, to map product flow through selected nodes while considering internal resource constraints and external lead-time variances. The platform evaluates and ranks proposed configurations using the three KPIs introduced in Figure 1—total supply chain cost, total lead time, and service level/tardy orders—each computed from the node-specific parameters provided by Module 2.
By analyzing these KPIs simultaneously, the system resolves trade-offs—such as choosing between a low-cost supplier with long lead times and a faster but more expensive alternative—and outputs a ranked list of supply chain configurations as a basis for sourcing decisions.
Application scenarios and limitations
The proposed framework addresses diverse supply chain configuration challenges.
- In precision manufacturing sourcing, it automates the discovery of qualified suppliers for technical components with strict tolerance and surface finish requirements, optimizing selection based on cost, lead time, reliability, and environmental constraints.
- For multi-tier network reconfiguration, it enables rapid evaluation of alternative supplier combinations during disruptions, quantifying resilience differences between single-sourcing and multi-sourcing strategies through node-level simulation.
- In sustainability-driven procurement, it enforces carbon footprint thresholds during discovery and quantifies cost premiums associated with low-carbon sourcing options.
- During market volatility, it reduces decision timelines from weeks to days; prototype validation of the simulation module demonstrates model generation in under six minutes at less than €0.25 per model, enabling rapid scenario evaluation without specialized expertise.
The framework presented here is a conceptual architecture; end-to-end integration of all three modules with real supplier data and procurement decisions remains a task for the future.
Practical deployment faces several additional challenges. AAS adoption remains limited, especially among small-to-medium enterprises lacking digital infrastructure, making widespread supplier participation uncertain. Suppliers may resist disclosing Tier 2 operational data due to competition concerns, requiring trust mechanisms such as secure governance protocols and tiered access controls. Additionally, the framework assumes accurate self-reporting, so verification through third-party audits or performance monitoring is necessary to maintain data credibility. Large-scale optimization problems involving many suppliers across multiple components require algorithms that maintain acceptable computation times.
A further limitation is the lack of delivery-level quality evidence: the approach does not yet model or ingest serialized inspection reports (CTQ parameters) and material certificates per shipment (lot/serial). As these records are often heterogeneous and partly unstructured, automated incoming inspection and end-to-end traceability are only partially supported at this point. Finally, shifting from relationship-based to data-driven supplier selection requires cultural change and gradual integration alongside existing procurement processes.
A data-driven industrial platform still under development
This paper presented a data-driven industrial platform that integrates semantic supplier discovery, automated simulation model generation, and supply chain configuration into a single, traceable decision-support workflow. Supplier capabilities and constraints are represented in AAS-based profiles structured by an Actor-Service ontology, enabling consistent requirement formulation, interoperable data exchange, and similarity-based shortlisting beyond keyword search.
These profiles then feed Module 2, which automatically generates supplier-specific discrete-event simulation models from Tier 2 data and facility layouts, translating operational parameters into lead-time and capacity evidence. Finally, configuration alternatives are compared using a fixed KPI interface, so that discovery outputs and simulation evidence feed directly into optimization-based selection.
The architecture supports repeated reconfiguration under changing conditions while maintaining continuity from requirements to final selection. Future work should address AAS adoption barriers, data sharing trust mechanisms, and enterprise system integration, and validate the end-to-end workflow with real industrial datasets. Furthermore, the ontological Actor-Service structure underlying Module 1 provides a natural basis for knowledge graph representations, which could expose additional relational queries and open further research directions in supplier network analytics.
The authors used ChatGPT (OpenAI; GPT-5.2) as an AI-assisted editing and content-support tool during manuscript preparation to improve spelling, grammar, clarity, and readability and to support drafting and structuring of text. All AI-assisted output was reviewed and revised by the authors, who take full responsibility for the content of this publication.
This is an original article. The German translation can be accessed via DOI: 10.30844/I4SD.26.4.6
Bibliography
[1] Kleindorfer, P. R.; Saad, G. H.: Managing Disruption Risks in Supply Chains. In: Production and Operations Management 14 (2005) 1, pp. 53–68. DOI: 10.1111/j.1937-5956.2005.tb00009.x.[2] Zhao, K.; Zuo, Z.; Blackhurst, J. V.: Modelling supply chain adaptation for disruptions: An empirically grounded complex adaptive systems approach. In: J of Ops Management 65 (2019) 2, pp. 190–212. DOI: 10.1002/joom.1009.
[3] Pochard, S.: Managing Risks of Supply-Chain Disruptions: Dual Sourcing as a Real Option. Massachusetts Institute of Technology 2003. URL: dspace.mit.edu/handle/1721.1/30036, accessed 17.06.2026.
[4] Polyviou, M.; Rungtusanatham, M. J.; Reczek, R. W.; Knemeyer, A. M.: Supplier non-retention post disruption: What role does anger play? In: J of Ops Management 61 (2018) 1, pp. 1–14. DOI: 10.1016/j.jom.2018.07.001.
[5] Bode, C.; Wagner, S. M.: Structural drivers of upstream supply chain complexity and the frequency of supply chain disruptions. In: J of Ops Management 36 (2015) 1, pp. 215–228. DOI: 10.1016/j.jom.2014.12.004.
[6] Dias, C.: Corporate portals: a literature review of a new concept in Information Management. In: International Journal of Information Management 21 (2001) 4, pp. 269–287. DOI: 10.1016/s0268-4012(01)00021-4.
[7] Williamson, E. A.; Harrison, D. K.; Jordan, M.: Information systems development within supply chain management. In: International Journal of Information Management 24 (2004) 5, pp. 375–385. DOI: 10.1016/j.ijinfomgt.2004.06.002.
[8] Cowan, R.: Expert systems: aspects of and limitations to the codifiability of knowledge. In: Research Policy 30 (2001) 9, pp. 1355–1372. DOI: 10.1016/s0048-7333(01)00156-1.
[9] Choi, T. Y.; Hartley, J. L.: An exploration of supplier selection practices across the supply chain. In: J of Ops Management 14 (1996) 4, pp. 333–343. DOI: 10.1016/S0272-6963(96)00091-5.
[10] Lee, Y. H.; Cho, M. K.; Kim, S. J.; Kim, Y. B.: Supply chain simulation with discrete–continuous combined modeling. In: Computers & Industrial Engineering 43 (2002) 1–2, pp. 375–392. DOI: 10.1016/S0360-8352(02)00080-3.
[11] Schemm, J.; Legner, C.: Toward the Inter-organizational Product Information Supply Chain – Evidence from the Retail and Consumer Goods Industries. In: JAIS 9 (2008) 4, pp. 119–150. DOI: 10.17705/1jais.00156.
[12] Schubert, P.; Legner, C.: B2B integration in global supply chains: An identification of technical integration scenarios. In: The Journal of Strategic Information Systems 20 (2011) 3, pp. 250–267. DOI: 10.1016/j.jsis.2011.04.001.
[13] Lorenz, R.; Kraus, M.; Wolf, H.; Feuerriegel, S.; Netland, T. H.: Selecting advanced analytics in manufacturing: a decision support model. In: Production Planning & Control 35 (2024) 7, pp. 711–724. DOI: 10.1080/09537287.2022.2126951.
[14] Sapel, P.; Gannouni, A.; Abdelrazeq, A.; Hopmann, C.; Schmitt, R. H.: Purposeful decision-support with Digital Shadows: a model catalog architecture and its implementation for production scheduling in the injection molding domain. In: International Journal of Production Research (2025), pp. 1–25. DOI: 10.1080/00207543.2025.2573194.
[15] Durugbo, C.: Integrated product-service analysis using SysML requirement diagrams. In: Systems Engineering 16 (2013) 1, pp. 111–123. DOI: 10.1002/sys.21229.
[16] Moheb-Alizadeh, H.; Handfield, R.: An integrated chance-constrained stochastic model for efficient and sustainable supplier selection and order allocation. In: International Journal of Production Research 56 (2018) 21, pp. 6890–6916. DOI: 10.1080/00207543.2017.1413258.
[17] Benjaafar, S.; Li, Y.; Daskin, M.: Carbon Footprint and the Management of Supply Chains: Insights From Simple Models. In: IEEE Trans. Automat. Sci. Eng. 10 (2013) 1, pp. 99–116. DOI: 10.1109/TASE.2012.2203304.
[18] Tantik, E.; Anderl, R.: Integrated Data Model and Structure for the Asset Administration Shell in Industrie 4.0. In: Procedia CIRP 60 (2017), pp. 86–91. DOI: 10.1016/j.procir.2017.01.048.
[19] Lee, J.-H.; Moon, I.-K.; Park, J.-H.: Multi-level supply chain network design with routing. In: International Journal of Production Research 48 (2010) 13, pp. 3957–3976. DOI: 10.1080/00207540902922851.
[20] Choi, T. Y.; Krause, D. R.: The supply base and its complexity: Implications for transaction costs, risks, responsiveness, and innovation. In: J of Ops Management 24 (2006) 5, pp. 637–652. DOI: 10.1016/j.jom.2005.07.002.
[21] Tomlin, B.: On the Value of Mitigation and Contingency Strategies for Managing Supply Chain Disruption Risks. In: Management Science 52 (2006) 5, pp. 639–657. DOI: 10.1287/mnsc.1060.0515.
[22] Aouadni, S.; Aouadni, I.; Rebaï, A.: A systematic review on supplier selection and order allocation problems. In: J Ind Eng Int 15 (2019) S1, pp. 267–289. DOI: 10.1007/s40092-019-00334-y.
[23] Ware, N. R.; Singh, S. P.; Banwet, D. K.: A mixed-integer non-linear program to model dynamic supplier selection problem. In: Expert Systems with Applications 41 (2014) 2, pp. 671–678. DOI: 10.1016/j.eswa.2013.07.092.
[24] Luan, J.; Yao, Z.; Zhao, F.; Song, X.: A novel method to solve supplier selection problem: Hybrid algorithm of genetic algorithm and ant colony optimization. In: Mathematics and Computers in Simulation 156 (2019), pp. 294–309. DOI: 10.1016/j.matcom.2018.08.011.
[25] Parmigiani, A.; Klassen, R. D.; Russo, M. V.: Efficiency meets accountability: Performance implications of supply chain configuration, control, and capabilities⋆,” J of Ops Management 29 (2011) 3, pp. 212–223. DOI: 10.1016/j.jom.2011.01.001.
[26] Shin, H.; Collier, D. A.; Wilson, D. D.: Supply management orientation and supplier/buyer performance. In: J of Ops Management 18 (2000) 3, pp. 317–333. DOI: 10.1016/S0272-6963(99)00031-5.
[27] Vachon, S.; Halley, A.; Beaulieu, M.: Aligning competitive priorities in the supply chain: the role of interactions with suppliers. In: International Journal of Operations & Production Management 29 (2009) 4, pp. 322–340. DOI: 10.1108/01443570910945800.
[28] Ghodsypour, S.; O’Brien, C.: The total cost of logistics in supplier selection, under conditions of multiple sourcing, multiple criteria and capacity constraint. In: International Journal of Production Economics 73 (2001) 1, pp. 15–27. DOI: 10.1016/S0925-5273(01)00093-7.
[29] Guiffrida, A. L.; Nagi, R.: Cost characterizations of supply chain delivery performance. In: International Journal of Production Economics 102 (2006) 1, pp. 22–36. DOI: 10.1016/j.ijpe.2005.01.015.
[30] Larsen, C.; Thorstenson, A.: The order and volume fill rates in inventory control systems. In: International Journal of Production Economics 147 (2014), pp. 13–19. DOI: 10.1016/j.ijpe.2012.07.021.
[31] Kuo, T. C.; Chen, G. Y.-H.; Wang, M. L.; Ho, M. W.: Carbon footprint inventory route planning and selection of hot spot suppliers. In: International Journal of Production Economics 150 (2014), pp. 125–139. DOI: 10.1016/j.ijpe.2013.12.005.
[32] de Ron, A. J.; Rooda, J. E.: OEE and equipment effectiveness: an evaluation. In: International Journal of Production Research 44 (2006) 23, pp. 4987–5003. DOI: 10.1080/00207540600573402.
[33] Little, J. D. C.: A Proof for the Queuing Formula: L = λ W. In: Operations Research 9 (1961) 3, pp. 383–387. DOI: 10.1287/opre.9.3.383.
[34] Enginarlar, E.; Li, J.; Meerkov, S. M.; Zhang, R. Q.: Buffer capacity for accommodating machine downtime in serial production lines. In: International Journal of Production Research 40 (2002) 3, pp. 601–624. DOI: 10.1080/00207540110091703.
[35] Kohi, K.: Utilizing digital tools in the new supplier discovery process. URL: aaltodoc.aalto.fi/handle/123456789/127853, accessed 17.06.2026.
[36] Asset administration shell for industrial applications — Part 1: Asset administration shell structure (IEC 2023).
[38] Weber, H.; Glück, R.; Krebs, F.: Leveraging semantic interoperability in Industry 4.0: an opportunity for automated task planning for discrete manufacturing processes. Augsburg, Deutschland 2025.
[39] Hedberg, T.; Lubell, J.; Fischer, L.; Maggiano, L.; Feeney, A. B.: Testing the Digital Thread in Support of Model-Based Manufacturing and Inspection. In: Journal of computing and information science in engineering 16 (2016) 2. DOI: 10.1115/1.4032697.
[40] Tang, D.; Qian, X.: Product lifecycle management for automotive development focusing on supplier integration. In: Computers in Industry 59 (2008) 2–3, pp. 288–295. DOI: 10.1016/j.compind.2007.07.002.
[41] Srinivasan, V.: An integration framework for product lifecycle management. In: Computer-Aided Design 43 (2011) 5, pp. 464–478. DOI: 10.1016/j.cad.2008.12.001.
[42] Ameri, F.; Patil, L.: Digital manufacturing market: a semantic web-based framework for agile supply chain deployment. In: Journal of Intelligent Manufacturing 23 (2012) 5, pp. 1817–1832. DOI: 10.1007/s10845-010-0495-z.
[43] Ameri, F.; McArthur, C.: A multi-agent system for autonomous supply chain configuration. In: The International Journal of Advanced Manufacturing Technology 66 (2013) 5, pp. 1097–1112. DOI: 10.1007/s00170-012-4392-9.
[44] Resnik, P.: Semantic similarity in a taxonomy: An information-based measure and its application to problems of ambiguity in natural language. In: Journal of Artificial Intelligence Research 11 (1999), pp. 95–130.
[45] Tversky, A.: Features of similarity. In: Psychological Review 84 (1977) 4, pp. 327–352.
[46] Ganesh, P.; Kute, S.; Lang, S.: Semantic Parsing of Manufacturing Layouts via Hybrid AI Agents for Automated Simulation Model Generation. In: IFAC-PapersOnLine, forthcoming
Your downloads
Solutions: Logistics Logistics Technology
You might also be interested in