Using Process Mining to Improve Logistics Performance in Production |
An application from customized hydraulic component manufacturing
| Journal | Industry 4.0 Science |
| Issue | Volume 40, Edition 3, Pages 54-60 |
| Bibliography | Share | Cite | Download |
Abstract
Article
In make-to-order manufacturing, the customer triggers the manufacture of a product and, in addition to the technical requirements of product specification and quality, also has logistical requirements for the processes. These include, for example, reliable throughput times that are as short as possible. Reliable and short delivery times are essential in competitive markets and can serve as a distinguishing feature [1].
High product variance makes it more difficult to meet these logistical requirements, as high product variance is usually accompanied by complex material flows. Although a flexible workshop production is able to master different material flows, the problem often lies in long and highly variable throughput times [2]. Transportation, idle and waiting times make up a large part of these throughput times and can easily amount to 80 to 90 % [3].
However, throughput time can be controlled, and work-in-process (WIP) plays a key role in this. The relationship between work in process and throughput time is modeled both by Little’s law [4] and by the funnel formula [5]. It can be deduced from both models that establishing inventory control makes it possible to control throughput time. Adherence to delivery dates is also undisputedly of high practical relevance as a logistical target variable, and initial modeling approaches towards this end have existed since the 2000s [6].
Further work in this area can be summarized – in very simplified terms – as follows: Production backlog is largely responsible for the mean deadline deviation of orders, while the dispersion of the deadline deviation is triggered by sequence deviations [7].
The Lödding production control model (Figure 1) visualizes the relationships described and supplements them with findings from production control by placing task deriving from production control into a logic-based relationship with the logistical objectives [8]. For example, the order approval determines the time at which a production order is approved for production and thus defines the actual receipt. The difference between actual input and actual output is the work-in-process of the manufacture. It can be stated thus: Logistical target values are controllable.
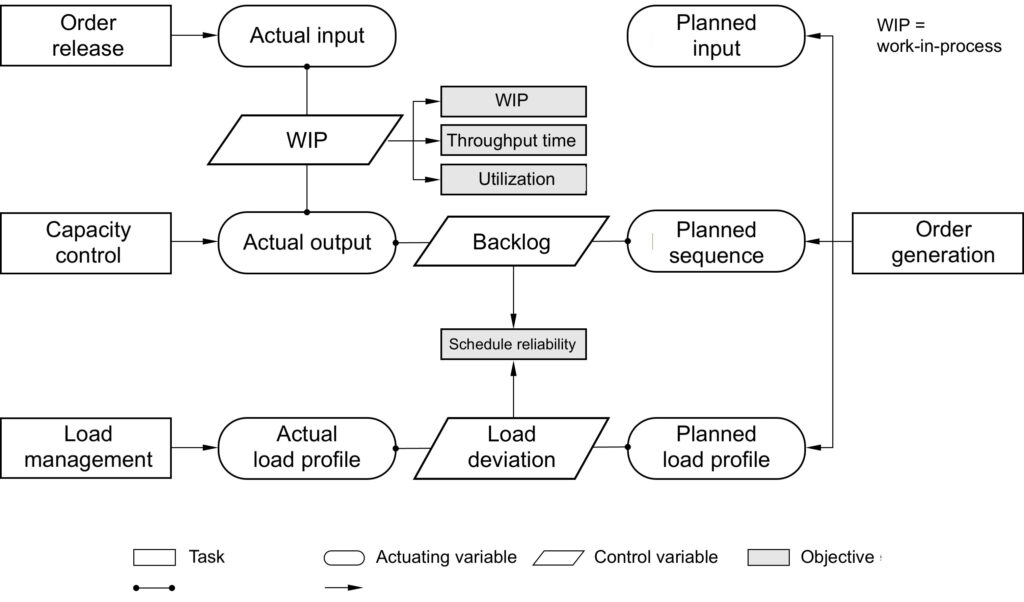
In order to make production control as effective as possible, a detailed overview of the logistical objectives and control variables is required in addition to an understanding of logistical interrelationships on the shop floor. The greater the transparency of information, the more effectively production can be controlled and deviations responded to. Process mining is now a proven approach that can create the required transparency. Process mining uses event data from existing information systems, for example, to visualize process flows, identify weak points and deviations and diagnose performance characteristics [9].
The combination of model-based knowledge of interdependencies and data-based process transparency enables more effective production control. The process is divided into four steps, the content of which is based on the PM2 model. This model provides for the following methodological steps: Planning (1), Data extraction (2), Data processing (3), Mining & analysis (4), Evaluation (5), and Continuous improvement (6) [10].
Step 1: Preparatory process analysis
In high variance production, the amount of digitally available information is constantly increasing and information systems are becoming increasingly complex. In order to support people as a factory’s most intelligent resource for decision-making, information should be provided in the right form, at the right time and in the right place.
To design the information flows precisely, a profound understanding of the processes actually taking place is necessary. A process analysis, which records the material and information flows based on a value stream analysis [10], is suitable for this purpose. In this case, the project team recorded the actual and target processes of two product groups and examined the following questions:
- What are the actual processing sequences for both product families and what control and feedback points exist via which the work systems can communicate with the higher-level production planning module in the ERP system?
- Which routing variants exist within a given product family? Answering this question is crucial for later filtering in the dashboard, as the same products can have different routings when manufactured on different machines, for example.
- What types of waste are currently generated in the process? This also explicitly refers to informational waste, such as multiple confirmations of an order at a confirmation point or a lack of information flow.
The process analysis first visualizes the sequence of the material flow and the informational interaction of the various processes with the higher-level production planning and control (ERP system) in a simplified form. In addition, waste in the information supply, such as missing or oversupplied information, can be identified. The next step configures the target processes for the information flows. For example, multiple confirmations from a machining center are bundled into one confirmation at the end of the last step that the machining center fulfills.
Deliberate effort should be taken to ensure that employees responsible for production control are only provided with order information that is relevant to them, allowing them concentrate on the aspects that can be influenced. Classic elements of a value stream analysis method, such as Kanban control or the establishment of one-piece flow, were deliberately not taken into account in this case.

Step 2: Extracting data and modeling required key metrics
Before the data can be extracted from the ERP system, it is necessary to understand the structure of the data. On the one hand, the tables in the ERP system that contain the selected data must be identified. On the other hand, possible links between the tables must also be registered. In the first draft, this project extracted data from seven tables in the Production Planning and Control (PP) module. These include, for example, the order master data (AUFK table) or tables with information on work processes (AFVC) and order confirmations (AFRU). Order and work process information is primarily required for the visualization of the order flow.

The actual dates can be used to map the actual material flows and compare them with the planned processes. In this case, process mining uses a small amount of simple feedback data (time stamps) to conduct insightful and meaningful analyses. The time stamps are transferred into process maps, where their visualization can contribute to more intuitive data interpretation and thus more intelligent decision-making.
This includes:
While the value stream method, for example, only provides a snapshot of the production processes, process mining also delivers statistically reliable results. For example, the order and work process throughput times can be determined for all orders produced in a specific period. The following applies to the actual order throughput time [11]:
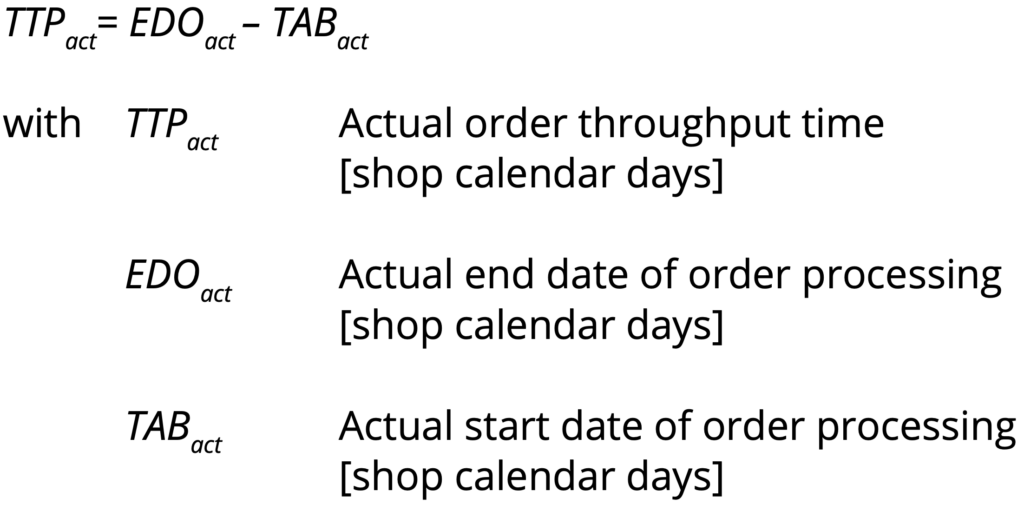
The analog data of the operations (their respective starts and ends) can also be used to determine operation throughput times. It must be ensured that the processing start of a work operation corresponds to the processing end of the preceding work operation. This ensures that the throughput time of an operation includes all throughput time elements, such as transportation between two operations, idle times due to inventory levels and the actual processing time. The sum of the work process throughput times throughout the critical stages of an order results in the order throughput time.
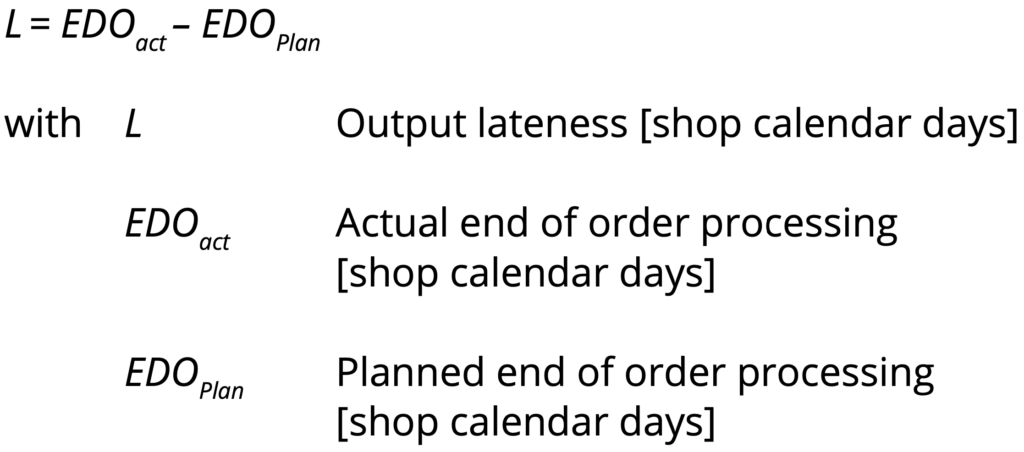
In addition to the lead time, the deadline deviation of an order or work process is also a key metric that describes the logistical performance of a production facility. It is defined as the length of time by which an order or work process is completed late (or early) [8] and can also be calculated using simple time stamps:
Step 3: Creating the dashboards
In the pilot project, eight different process mining dashboards were created to display the basic logistics KPIs of two production families. The landing page first provides an overview of the completed orders, their throughput times and the current work in process, and then directs users to the more in-depth dashboards.
One central dashboard is the Process Explorer, which visualizes the throughputs from opening to order approval to completion for each production family (or production area) under consideration. Figure 3 shows the dashboard for one of the two production families with a selected production order. This order requires eleven calendar working days from opening to completion. The throughput time is measured in workdays, rounded to whole days. For this reason, some lead times are given as 0 workdays.
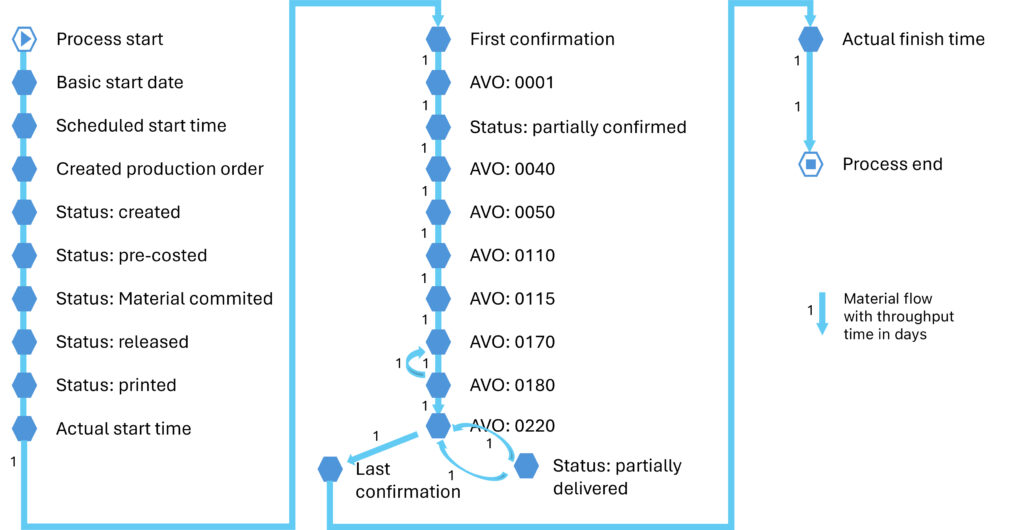
The dashboard allows users to filter by the characteristics mentioned in order to be able to examine specific time periods, product groups, production families or orders. The active filters can be seen at the top of the dashboard. In order to be able to compare the lead time of the product groups, a uniform routing structure is required.
If individual work processes are skipped or carried out on alternative machines, the upstream and downstream processes should still have the same process numbers. This is not yet the case throughout the company in question, but standardization to this effect is currently being implemented.
User tip: To develop a comprehensive and accurate analysis model for the manufacturing families under consideration, advanced knowledge of the process query language PQL is essential. PQL allows users to convert process-related business queries into queries that are executed by a custom query engine. PQL contains many operators, ranging from process-specific to mathematical functions and aggregations.
Step 4: Integrating the dashboard into the production control system
Intuitive visualization and near real-time determination of the production situation from a logistics perspective are fundamental elements of targeted production control. Their incorporation offers two significant advantages: Firstly, the information obtained can be used to make data-based decisions, which improves the quality of decisions and therefore the production control. Secondly, control decisions can be made more quickly, which benefits the flexibility and customer orientation of the overall system. For example, the production controller can react immediately to schedule deviations in order throughput or fluctuations in the work-in-process and thus avoid any impact on the customer.
This type of control can be implemented in the long term through shop floor management. As a management principle, shopfloor management stands for the control of processes and communication between employees from different hierarchies at the point of value creation. This places the focus on the place of value creation, the factory floor, and enables problems to be solved in a targeted and structured manner. The following aspects should be taken into account:
- Establishment of an effective communication structure
- Visualization of key metrics on a (digital) shop floor dashboard
- Definition of limit values and intervention limits
- Definition of a structured problem-solving process
The communication structure includes cascaded information on one hand and the establishment of an efficient meeting process on the other. Meetings therefore often take place standing up, have a fixed agenda that is characterized by previously defined key metrics and clearly defines the roles of the participants. The visualization is mainly done on a shop floor dashboard, which is traditionally set up in analog form, but can also be easily digitized – as in this case.
It should be noted that the digital boards are often less present, as the monitors are only used for the duration of the meeting. If the reported key figures deviate from their planned values, this triggers the problem-solving process. The developed dashboards enable the participants of shop floor meetings to react to deviations from the planned throughput times. If the waiting times for orders exceed previously defined threshold values, certain escalation levels come into effect. In the interests of continuous improvement, the acceptable waiting times should be gradually reduced. In this specific operational use case, there are three stages: Observe, Check and Escalate.
This is followed by a structured problem-solving process which, based on a clear definition of the problem, first examines the root causes of the problem, derives countermeasures to eliminate the causes and finally standardizes these.
System data quality as the key to success
A key finding from the operational project work is that a standardized work plan structure and the ongoing maintenance of the work plans in an ERP system are particularly important for the long-term success of the project, and that the effort involved should not be underestimated. As is so often the case with digitalization projects, the quality of the system data is crucial.
Bibliography
[1] Wiendahl, H.-P.: Auftragsmanagement der industriellen Produktion. Grundlagen, Konfiguration, Einführung. Berlin, Heidelberg (2012).[2] Wiendahl, H.-P.: Fertigungsregelung. Logistische Beherrschung von Fertigungsabläufen auf Basis des Trichtermodells. Munich, Vienna (1997).
[3] Brenzke, D. et al.: Betriebswirtschaftslehre für Ingenieure: Lehr- und Praxisbuch. Berlin (2021).
[4] Little, J. D. C.: A Proof of the Queuing Formula: L = λ W. In: Operations Research 9 (3), pp. 383-387 (1961).
[5] Bechte, W.: Steuerung der Durchlaufzeit durch belastungsorientierte Auftragsfreigabe bei Werkstattfertigung. Düsseldorf (1984).
[6] Yu, K.-W.: Terminkennlinie: Eine Beschreibungsmethodik für die Terminabweichung im Produktionsbereich. Düsseldorf (2001).
[7] Kuyumcu, A.: Modellierung der Termintreue in der Produktion. Hamburg (2013).
[8] Lödding, H.: Verfahren der Fertigungssteuerung: Grundlagen, Beschreibung, Konfiguration. Berlin, Heidelberg (2016).
[9] van der Aalst, W.; Carmona, J. (Eds.): Process Mining Handbook. Aachen (2022).
[10] van Eck, M. L. et al.: PM2 : A Process Mining Project Methodology. In: Advanced Information Systems Engineering. Cham (2015).
[11] Erlach, K.: Wertstromdesign: Der Weg zur schlanken Fabrik. Berlin, Heidelberg (2010).
[12] Nyhuis, P.: Logistische Kennlinien: Grundlagen, Werkzeuge und Anwendungen. Berlin, Heidelberg (2012).
You might also be interested in