Error Management in Production |
Current situation and challenges in the industry
| Journal | Industry 4.0 Science |
| Issue | Volume 41, Edition 2, Pages 38-45 |
| Bibliography | Share | Cite | Download |
Abstract
Keywords
Article
Manufacturing companies are facing increasingly complex challenges, particularly due to the growing variety of product variants. This development results in smaller batch sizes and more complicated production processes due to the necessary flexibility adjustments [1]. The increasing demand for flexibility and the growing complexity of production processes significantly increase the probability of errors and malfunctions. Disruptions in networked production processes can affect downstream processes and impair system performance. In this context, it is becoming increasingly important for companies to develop suitable methods for the rapid detection of faults and long-term rectification of failures to ensure the continued efficiency of their production systems. [2]
Based on a survey involving 23 companies, this study explores experience-based error management in production. The survey provides an up-to-date, cross-industry picture of the latter and considers challenges and approaches as a basis for in-depth analyses.
Current research: An overview
Error management in production is a key element of process optimization and quality assurance. Research has introduced a variety of approaches to error detection, analysis and error management. These methods emphasize the importance of a systematic strategy aimed at preventing errors and fostering continuous improvement. Established methods, such as the 8D report, the 5W method and the failure mode and effects analysis (FMEA), are often used simultaneously thus ensuring comprehensive and effective problem-solving.
A widely recognized model in this area is the Aachen Complaint and Failure Management Model (CFM Model), which provides a thorough, data-driven reference process for integrated complaint and failure management. This model is divided into three levels: the operational level for error detection and correction, the management level for coordination and control and the support level for training and IT infrastructure. The aim is to identify the causes of errors, develop appropriate measures and check their effectiveness to continuously improve the efficiency of error management [3]. The Aachen Model offers a structured approach designed to systematically support these tasks while creating a reliable foundation for error analyses and solutions [3].
Rüßmann et al. show how smart error management, supported by digitalization and networking, can be successfully implemented in small and medium-sized enterprises (SMEs). This involves using a mobile app to document errors and a central management console to oversee the data. Implementing such systems can improve the error culture, promote greater transparency, and support optimized process design [4].
Beckschulte et al. developed a process model for structuring the manual recording of errors in the assembly of commercial vehicles. Due to the increased complexity and error susceptibility in customized mass production, a five-stage model was designed to encompass all steps, from defect object recording to the addition of free text information. This model enhances data quality and facilitates the use of data analytics approaches for process optimization [5].
Günther et al. introduced an AI-based Decision Support System (DSS) that leverages data from the entire value chain to proactively detect and prevent errors. The system features a dialogue interface, a knowledge database and an inference mechanism contingent on evidence-based decision-making to support production and maintenance. In addition, the DSS incorporates an expert system that models uncertainties through probabilities, enabling informed decision-making [6].
Hellebrandt et al. created a model for complaint management in product development based on the Analytical Network Process (ANP). This model aims to systematically capture knowledge from technical complaints, integrating the latter into product development.
The process consists of three modules: Acquisition (collection of relevant information), Analysis (specific case analyses and comprehensive failure data analyses) and Distribution and Utilization (transfer of acquired knowledge into development). The results indicate that different knowledge management solutions are most effective depending on the phase of knowledge transfer and emphasize the relevance of structured approaches to leveraging complaints as a source of knowledge [7].
Method
As part of this publication, a survey was conducted to identify the key criteria for effective, experience-based error management in production. The target group consisted exclusively of manufacturing companies in Germany, representing industries such as automotive, pharmaceuticals, food and construction.
Most questions were designed using a Likert scale, allowing respondents the opportunity to express their agreement or disagreement in a nuanced way. This approach facilitates quantitative analysis by converting qualitative data into measurable values [8]. Participants could select the following options on a graduated scale: “strongly disagree”, “disagree”, “undecided”, “agree” and “strongly agree”.
The Likert scale enables differentiated documentation of opinion nuances, thus offering higher accuracy than simple yes/no questions. It generates ordinal-scaled data that can be statistically analyzed, allowing mean values, standard deviations and trends to be calculated and response patterns to be identified [9]. In addition, optional free-text fields were included to capture participants’ subjective perspectives.
The survey consists of eight main categories, allowing for a comprehensive analysis of the various aspects of error management:
- Communication and error culture
- Error detection and documentation
- Error analysis and root cause identification
- Error correction
- Knowledge management
- IT systems and technological support
- Use of KPIs
- Management support
Each topic was addressed through carefully selected items, with the selection designed to ensure the survey could be completed within 15 minutes.
The questions on communication and error culture included aspects such as openness of communication and perceiving errors as learning opportunities. The category error detection and documentation focused on recording frequency, documentation guidelines and accessibility of documents. Error analysis and root cause identification included questions on analysis processes, data inclusion and implementation of results. Error correction looked at standardized processes, flexibility and continuous quality control.
Knowledge management questions inquired about standards for knowledge storage, data accessibility and integration of experience into production processes. IT-based prompts covered the use of specific software and devices for error detection and analysis. Inquiries about key figures and KPIs covered their application, analysis and impact on the effectiveness of the measures. The management support section addressed the allocation of financial, human and time resources.
The survey was created using the online tool Sosci Survey (soscisurvey.de), which is hosted in Germany and available free of charge for scientific research. Conclusions about individual companies were prevented by guaranteeing the anonymity of all participants.
Reliability and linear regression analyses were conducted to assess the quality of the collected data and to investigate correlations between variables.
Reliability analysis evaluates the internal consistency of the scales used, determining whether the answers to a set of questions (referred to as items), designed to measure a common topic, align well. A high consistency value indicates a reliable scale that uniformly represents a construct – i.e. a theoretical term such as “employee satisfaction” [9].
Linear regression analysis examines how independent variables—referred to as predictors—relate to a dependent variable. In this case, the dependent variable formed the final control question: “Would you classify error management in your production as successful and do you effectively leverage previous experience?” (the answer was based on a Likert scale). As an example, the extent to which the number of training measures (predictor) influences productivity (target variable) could be investigated. This method allows the influence of individual predictors to be quantified and presented as measurable figures. [8]
Progress and results
More than 730 companies were contacted as part of the survey, 23 of which completed the survey. The low number of fully completed surveys represents a limitation in terms of statistical significance. A minimum of 100 complete responses would be required for a well-founded analysis. Due to the limited sample size, the interpretation of p-values, which are used to determine statistical significance, is only possible to a limited extent.
Even with a high p-value, the significance of the results remains questionable, as the small number of cases impairs the reliable estimation of the underlying correlations. The p-value indicates the probability that an observed effect or difference in the data occurs purely by chance, provided the null hypothesis is correct [8].
Nevertheless, the available data offers an initial qualitative overview of potential trends and patterns within the subject areas examined. The findings can serve as a foundation for further research and offer preliminary insights into correlations and influencing factors.
The following evaluation of the collected data presents an initial overview of the participants’ demographic and professional characteristics: The age distribution ranges from under 25 to over 65, with the 25-38 age group representing the largest group at 34.8%. A further 26.1 % were aged between 35 and 44, while smaller proportions were recorded in the 45-53 (8.7 %), 55-64 (26.1 %) and over 65 (4.3 %) age groups. The majority of respondents (87 %) were employed full-time.
The participants held different positions, with the most common one being that of a quality manager (34.8%). Other roles included production manager (17.4 %), quality inspector (8.7 %), quality engineer (8.7 %) and quality manager (4.3 %).
The length of service varies, with the largest group (65.2%) having been with the company for over six years. Another 21.7 % have worked at the same company for three to four years.
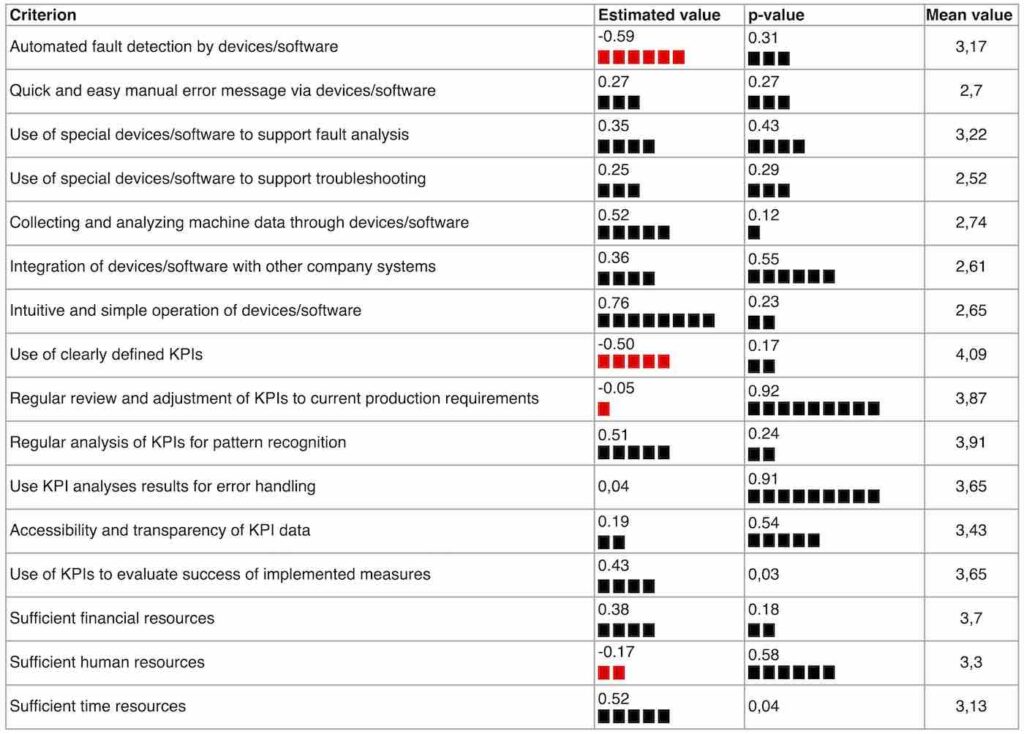
In the following, the remaining questions, except for the free text and control questions, are assigned to their respective categories and presented. The corresponding survey results are supplemented by the mean value, the estimated value and the p-value. The mean value is derived from the Likert scale, which ranges from 1 to 5 and indicates the extent to which the respective criterion is present in the company.
The estimated value reflects the influence of the independent on the dependent variable, quantifying how a change in the independent variable (also measured on the Likert scale) affects the dependent variable. This reveals whether, and to what extent, there is a positive or negative relationship between the variables.


Results analysis
The study identified key factors impacting the effectiveness and success of error management in production.
Openly communicating errors on a regular basis while offering comprehensive support and solutions are crucial. Employees require access to regular training and workshops in error management and a constructive error culture. The qualitative analysis emphasizes the need for personal discussions and transparency as measures for effective error management. It is equally important to promote a positive attitude towards mistakes as an opportunity for improvement.
Regarding error detection and documentation, the results show that systematically recording and documenting errors have the greatest positive influence on the dependent variable. In second place is the accessibility of documentation. Clear guidelines and procedures for recording errors, on the other hand, have a comparatively smaller effect on the dependent variable. According to the results, the use of specific devices and software for error recording has a negative influence on error management.
The most significant positive influence on error detection and root cause analysis comes from consistently applying insights gained from previous error analyses. This is followed by the importance of transparency, conducting systematic evaluations, and adapting solutions to fit each specific case. The use of established methods, immediate analyses, repeat analyses and the consideration of all error-related data have a negative impact. The results highlight the importance of evaluating measures in a context-specific manner.
The results around error correction indicate that continuous and detailed documentation of results has the strongest positive influence, followed by the use of standardized methods, the goal of sustainable error prevention and the transparency of results. On the other hand, flexible methods, immediate measures and regular monitoring of implemented measures have a negative influence, with the latter having the strongest negative effect. The results underline the importance of a targeted selection of methods and processes in error management.
In knowledge management, the results indicate that the most significant positive influence comes from systematically storing data in a central error database. While less pronounced, defined standards for recording knowledge and ensuring the quality of documented error reports also have a positive impact. The only negative influence observed is related to the transparency and accessibility of error data in the error database.
The evaluations in the area of IT systems and technological support highlight that the collection and analysis of machine data through devices and software, along with their intuitive operation, have the strongest positive impact. This is followed by the integration of these systems with other company systems. The use of specialized devices and software to support fault analysis, as well as quick and easy manual fault reporting, also has a positive effect. However, the use of special devices for error correction has a less positive impact. Automated error detection through devices/software on production systems has a negative effect.
Regarding the use of KPIs, regular analysis for pattern recognition has the strongest positive impact, followed by using KPIs to evaluate the success of implemented measures. Additionally, the accessibility and transparency of KPI data, along with applying KPI analysis results to error handling, also contribute positively. Conversely, regularly reviewing and adjusting KPIs to meet current production requirements, as well as using strictly defined KPIs, show a negative impact.
In the area of management support, the strongest positive influence comes from adequate financial resources, followed by sufficient resources in time. However, having an adequate number of human resources has a slightly negative influence.
Systematic error analysis for higher production output
This study explores experience-based error management in production. Through a survey involving 23 manufacturing companies in Germany, aspects such as error detection, documentation, analysis and correction were examined. The results indicate that systematic error analysis and the incorporation of its findings into the production processes are crucial for achieving sustainable improvements in production performance.
Based on these results, a methodology will be developed to establish improved experience-based error management in companies.
This article was written as part of the project “erFeMa – Experience-based error management in the context of production”, which is funded by the Federal Ministry of Education and Research (BMBF) under the grant number 03SF0758.
Bibliography
[1] Goldszmidt, M. et al.: Towards a Holistic Approach to Fault Management. In: Dependability and Computer Engineering: Concepts for Software-Intensive Systems. Hershey, PA 2012, pp. 1–10.[2] Knüppel, K.; Meyer, G.; Nyhuis, P.: A universal approach to categorize failures in production. In: World Academy of Science, Engineering and Technology, International Journal of Industrial and Manufacturing Engineering 8 (2014) 2, pp. 240.
[3] Tuertmann, R. et al.: Conceptual modelling of the Failure management process in the manufacturing industry. In: Total Quality Management & Business Excellence 28 (2017) 9-10, pp. 1041–1053.
[4] Bosse, C. K.; Zink, K. J. (ed): Arbeit 4.0 im Mittelstand. Berlin Heidelberg 2019, pp. 267–273.
[5] Beckschulte, S. et al.: Manuelle Fehleraufnahme bei Mass Customization. In: Zeitschrift für wirtschaftlichen Fabrikbetrieb 116 (2021) 4, pp. 188–192.
[6] Guenther, R. et al.: AI-Based Failure Management: Value Chain Approach in Commercial Vehicle Industry. In: Procedia CIRP 109 (2022), pp. 251–256.
[7] Hellebrandt, T. et al.: Knowledge management framework for complaint knowledge transfer to product development. In: Procedia Manufacturing 21 (2018), pp. 173–180.
[8] Fromm, S.: Datenanalyse mit SPSS für Fortgeschrittene 2: Multivariate Verfahren für Querschnittsdaten. Wiesbaden 2012.
[9] Willits, F. K. et al.: Another look at Likert scales. In: Journal of Rural Social Sciences 31 (2016) 3, pp. 126–135. URL: https://egrove.olemiss.edu/jrss/vol31/iss3/6, Abrufdatum 10.01.2025.
Your downloads
Potentials: Management
Solutions: Process Management Production Control Quality Management Risk Management