
Aiming to Create Green AI |
Putting a focus on AI energy efficiency and minimizing the CO2 footprint of AI-based systems
| Journal | Industry 4.0 Science |
| Issue | Volume 40, 2024, Edition 6, Pages 18-30 |
| Open Access | https://doi.org/10.30844/I4SE.24.6.18 |
| Bibliography | Share | Cite | Download |
Abstract
Article
Artificial Intelligence (Green AI) and Industry in the age of rising energy demand: challenges and solutions for sustainable development
As the world becomes increasingly interconnected, global energy demand is rising. This demand is driven by the need to support social and economic development. One of the biggest challenges for the industrial energy sector is ensuring a secure energy supply while simultaneously reducing its contribution to climate change [1].
Sustainable development has become a priority for many countries, and the United Nations has proposed a set of 17 global sustainable development goals to address this challenge [2]. These goals include affordable and clean energy, responsible production and consumption, and climate action—all measures aimed at reducing carbon emissions and addressing climate issues.
In recent years, the problem of climate change has intensified. According to the IPCC’s Sixth Assessment Report [3], numerous climate-related changes have occurred globally since the Fifth Assessment Report was published in 2014 [4]. These changes include rising global temperatures, rising sea levels, and shifting global precipitation patterns. Current climate policies and actions are insufficient to achieve the stated political goals. Therefore, sustainability and reducing the carbon footprint are high on the agenda for businesses worldwide.
This is reflected in the number of companies that have signed the Climate Pledge: as of December 2022, 378 companies with a combined market capitalization of $15 trillion have committed to achieving net-zero emissions by 2040. The list of companies committed to reaching the Paris Agreement’s goals ten years early includes Amazon, Best Buy, Henkel, IBM, Mercedes-Benz, Microsoft, Siemens, and Unilever. While such initiatives aim to reduce the overall carbon footprint, it is worthwhile to examine the individual contributors to global greenhouse gas emissions.
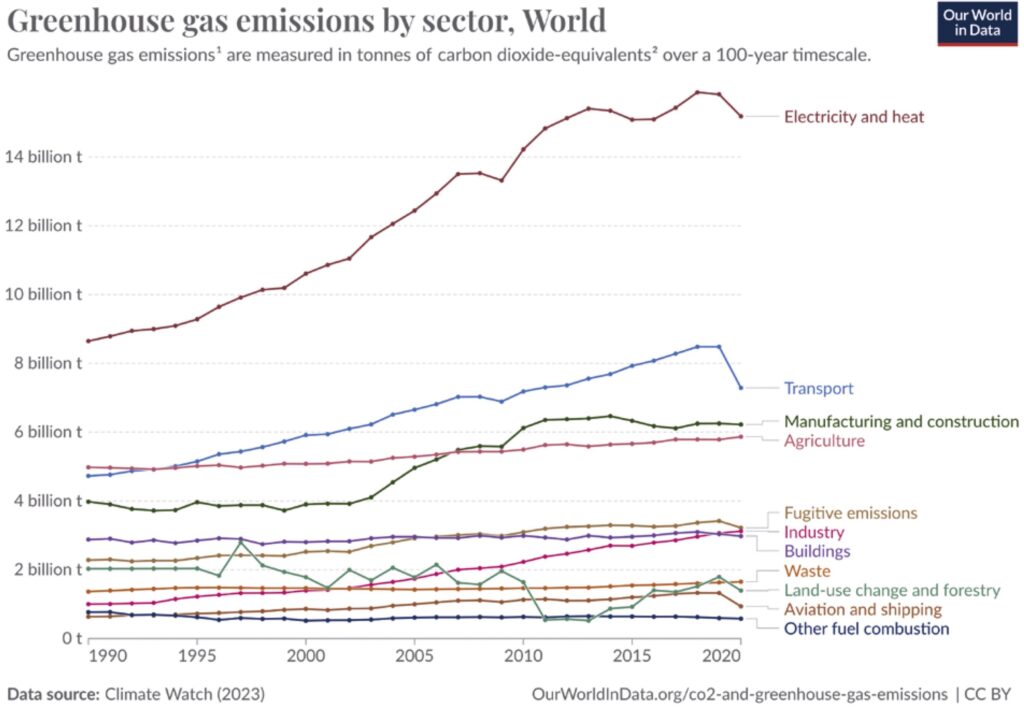
Figure 1 illustrates the contributors to global greenhouse gas emissions, with the largest portion coming from the energy sector. Among various industries, residential buildings, road transportation, iron and steel production, and other industries are significant contributors to global emissions. Calculating greenhouse gas emissions for many sectors can be challenging. Particularly in the information and communication technology (ICT) sector, various aspects such as hardware manufacturing, software, and network traffic must be considered.
In 2022, approximately 97 zettabytes of data were created, captured, copied, and consumed globally [5]. The devices generating, processing, and transmitting this data require energy, often in the form of electricity, which, depending on the energy source, leads to substantial carbon emissions. For instance, data centers account for 0.5% of carbon emissions in the United States [6]. AI is set to drive a 160% increase in data center power demand by 2030, as AI technologies like ChatGPT require significantly more energy than traditional services, pushing data centers’ global energy consumption from 1-2% to 3-4 %.
This surge will necessitate substantial investments in renewable energy and infrastructure, with the US requiring $50 billion for new generation capacity and Europe needing over $1.6 trillion to upgrade its grid and meet the growing energy demands, while carbon emissions from data centers are expected to more than double [7].
Numerous studies have investigated the ICT sector’s contribution to greenhouse gas emissions, summarized by [9]. They argue that, based on reviewed estimates, the ICT sector’s emissions range from 1.8% to 2.8% of global emissions, with the actual share potentially being between 2.1% and 3.9%. These estimates vary due to differences in analyst assumptions and associated uncertainties. [9] conclude that without significant efforts from policymakers and Industry, ICT-related greenhouse gas emissions are unlikely to decrease and may even increase.
For many years, CO2 emissions have been a central issue for transport and logistics companies. The transportation sector is a significant contributor to greenhouse gas emissions, accounting for 11% of the total emissions and continuing to grow [10]. Companies such as Maersk, Lineage Logistics, Paack Logistics, FedEx (committed to carbon-neutral transport by 2040), DHL, and UPS (aiming for 2050) have signed the Climate Pledge. While various mechanisms to reduce transport emissions have been implemented (e.g., green fuels, carbon offsetting, reporting, optimization), IT-related emissions have been overlooked.
However, these emissions are becoming increasingly important for transport and logistics companies. Large volumes of data (including shipments, customers, hubs, maps, and routes) are stored, analyzed, and processed by logistics companies. There are numerous ways to avoid or reduce such emissions, which will be subject of further investigation in this study.
Modern IT technologies (e.g., mobile internet, artificial intelligence, cloud technologies, the Internet of Things (IoT), and robotics) offer numerous business advantages for logistics companies, such as route optimization or predicting customer preferences. However, transmitting, storing, and processing data requires substantial energy, leading to CO2 emissions depending on the electricity mix.
Global web traffic, or the flow of data over the internet, is projected to reach approximately 4.2 zettabytes in 2022 [11], indicating that inefficient digitization threatens the climate. Training an innovative AI model can consume as much energy as 300 round-trip flights from San Francisco to New York or the entire lifecycle of 5 cars, including fuel [12].
Green AI and Clean IT: approaches to maximizing energy efficiency and minimizing the CO2 footprint
This paper aims to explore Green AI as a method for maximizing energy efficiency of Artificial Intelligence (AI) and thereby reducing the CO2 footprint of AI-based systems. The term Green AI refers to AI research that produces innovative results while considering the computational cost, promoting a reduction in the resources used [13].
Green AI is part of the Clean IT concept, which involves the “analysis and practice of designing, manufacturing, and using computer hardware, software, and communication systems that are efficient and effective, with minimal or no impact on the environment” [14]. Clean IT refers to the design, development, and use of energy-efficient hardware, software, and systems that minimize environmental impact, particularly by reducing energy consumption and CO2 emissions throughout the lifecycle of AI and IT operations.
While the topic also includes issues such as disposal and recycling, compliance, green labeling for IT products, and environmental risk mitigation, these aspects are not the focus of this study. Instead, it examines Clean IT from four distinct perspectives:
- AI Model Perspective: How can complex AI models be trained in an energy-efficient manner? This often involves a trade-off between model accuracy and resource consumption (energy efficiency).
- AI Algorithm and Database Perspective: How can databases and algorithms be designed to minimize energy consumption during operation? The concept of “sustainable programming” addresses various aspects of software development in this context.
- AI Data Center Perspective: How can data centers be optimized for energy consumption? This includes considerations of both cloud and on-premises solutions.
- AI Organization Perspective: How can an organization be equipped with energy-efficient IT devices? This section introduces the concept of Total Cost of Ownership.
These perspectives need to be considered as design objects and constructed in such a way that AI usage (use cases such as AI training, testing, inferencing, refinement) best meets energy efficiency and CO2 footprint objectives.
AI and sustainability: balancing performance and environmental impact
AI models and machine learning have achieved significant success due to the availability of large datasets, hardware improvements, and performance enhancements such as those provided by cloud computing. A variety of fields and tools is listed by [15].
However, large AI models, such as deep neural networks and Large Language Models (LLMs), consume substantial amounts of energy, leading to greenhouse gas emissions due to computational time and effort. While traditional machine learning (ML) algorithms reach a performance threshold beyond which predictions no longer improve, deep learning models continue to enhance their performance with more data [16].
Although the capabilities of technical systems have not yet matched human intelligence, machines can already surpass humans in certain tasks, such as image recognition [17, 18]. This demonstrates that deep learning aims to improve AI model accuracy without computational limitations. Often, Graphics Processing Units (GPUs) are used to accelerate training compared to Central Processing Units (CPUs), leading to high energy consumption during training. In natural language processing, model complexity and training time result in high costs [12].
The varying energy consumption and emissions of different AI applications pose a challenge, as few ML and AI experts know how to reduce the carbon footprint. Not all algorithms require frequent retraining, but in some areas, retraining occurs regularly and daily, which drastically increases energy consumption [19].
As a result, there is a need for improved algorithmic efficiency and quantification of data and computation in AI training [20] to ensure that AI can be considered environmentally conscious and sustainable, reducing unnecessary energy use and CO2 emissions. While “Green Computing” has primarily focused on hardware and cloud mechanisms, it has not yet addressed the algorithmic efficiency of AI.
Although there are existing approaches to estimate algorithmic greenhouse gas emissions, limitations remain regarding their broad applicability, the need for self-monitoring of power consumption, and constraints in hardware and software choices for AI tasks [19]. Therefore, there is a need for a broadly applicable method to assess emissions and energy use in AI applications and their reduction through management interventions.
Methodologically approaching Green AI – the Green AI realization framework
In a design-science-oriented manner [21], the aim is to create and test a method for measuring, visualizing and monitoring the energy consumption of AI-based systems and to derive recommendations for the design of a green and sustainable use of AI, or Green AI, in organizations. This is hereafter referred to as Green AI and considers an AI to be green and sustainable, in the sense that it (I) consumes the least amount of energy possible, (II) results in the least amount of carbon emissions possible, (III) generates the AI’s task in time, (IV) at the required quality level. The distinct perspectives listed are taken into account, which demands for various artifacts as they are presented in Figure 2.
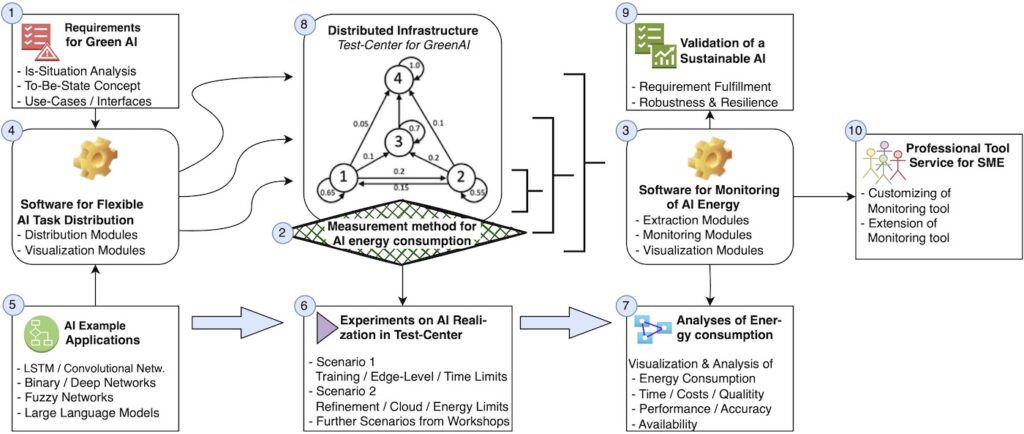
Initially, requirements for Green AI will be collected (see artifact 1 in Figure 2). At the end of the research cycle, these will be used to validate the Green AI and artifacts created (see artifact 9 in Figure 2). However, because there is no widely accepted method for assessing the emissions and energy consumption of AI applications and reducing them through management, a measurement method will be created to accurately measure the energy consumption of AI (see artifact 2 in Figure 2).
The procedure and tools developed will be tested in the “Test Center for Green AI” to be set up for this purpose at the University of Potsdam (see artifact 8 in Figure 2). This will follow design principles shown in [22] and provide realistic CPU and GPU devices for AI realization. The testing will rely on experiments (see artifact 6 in Figure 2) using various AI example applications (see artifact 5 in Figure 2). In-depth analyses are supposed to clarify energy waste as well as irrelevant CO2 emissions.
Artifact 3 shown in Figure 2 shall monitor AI energy so that software routines as well as hand-made management can intervene. Artifact 4 in Figure 2 shall characterize AI tasks and take care of efficient and energy optimal distribution in heterogenous IT infrastructures. By using various sample AI applications, different distribution strategies can be analyzed in regard to energy efficiency and CO2 emissions. Finally, services for the tool (see artifact 10 in Figure 2) can improve the energy- and CO2-optimized use of AI during the AI lifecycle.
Requirements for monitoring AI energy consumption and CO2 footprint
Internet research, paper studies, eight customer workshops as well as 14 SME interviews have supported the identification of requirements for a tool called Carbon Monitor.
Furthermore, a monitoring tool focusing on AI energy consumption as well as CO2 footprint should provide the following features.
1) Real-time emissions tracking: A critical feature of the Carbon Monitor is its capability to continuously monitor the power usage of the underlying hardware infrastructure. By measuring power consumption at frequent intervals, the tool provides developers with instantaneous data on the carbon emissions generated during computational tasks, enabling more informed decision-making.
2) Carbon intensity calculation: The tool enhances accuracy in emissions reporting by calculating the Carbon Intensity of the electricity used, based on the local energy source mix. This adjustment allows for region-specific emission data, reflecting the true environmental cost of electricity consumption in different geographical areas.
3) Global carbon intensity open data: Recognizing the global nature of many computational tasks, especially those deployed in open cloud environments, the Carbon Monitor incorporates carbon intensity metrics from major cloud providers such as Google Cloud Platform, Amazon Web Services, and Microsoft Azure [23]. This feature helps developers assess the carbon impact of different data center locations, facilitating more environmentally friendly decisions about data hosting.
4) Contextual comparison: To bridge the gap between abstract emissions data and tangible understanding, the Carbon Monitor contextualizes its outputs by equating them to everyday activities. By comparing computational emissions to common activities like driving a car or watching television, the tool makes the data more accessible and relatable to a broader audience.
5) Detailed output information: The tool provides a comprehensive set of outputs, including computation time, power consumption in kilowatt-hours, and emissions in kilograms of CO2 equivalents. Additionally, it specifies contextual details such as the country, cloud provider, and server location, offering a holistic view of the environmental impact.
6) Model optimization and comparison: Besides tracking, the Carbon Monitor also supports the optimization of machine learning models by allowing developers to weigh the trade-offs between model accuracy and energy efficiency. This capability supports the development of more sustainable AI applications by enabling the prioritization of models based on their performance and environmental impact.
Design and development of an AI Carbon Monitor
The Green Algorithms Dashboard by [19] provides a foundational approach for estimating the carbon emissions of various algorithms used in disciplines such as physics, atmospheric sciences, and machine learning. This dashboard is instrumental for setting benchmarks and comparing the carbon footprints of computational systems across different scientific fields. Recognizing the need for developers to monitor and understand the carbon impact of their work, especially during the development of AI models, the KRALLMANN Carbon Monitor was developed.
A sophisticated Python-based tool tailored for tracking and managing the carbon footprint of machine learning model training and other computational tasks. It intends to operationalize the Green AI Realization Framework and satisfies the six requirements specified above. This tool integrates seamlessly into existing workflows to provide real-time monitoring and management of the carbon footprint associated with the training of machine learning models and other computational tasks.
The principles underlying the design and development of the Carbon Monitor aim to equip developers with robust tools to minimize the environmental footprint of their computational tasks. The monitoring tool provides detailed, real-time, and context-aware insights into carbon emissions, which helps inform efforts to reduce the carbon impact of the tech industry and supports the broader goals of sustainability in technological developments, though it does not actively enhance sustainability itself. This comprehensive approach is essential for fostering responsible and environmentally conscious computational practices.
The Carbon Monitor puts out valuable information such as duration in seconds, power consumption in kilowatt-hours (kWh), emissions expressed in kilograms of CO2 equivalents (kg CO2eq), country name, cloud provider if computations are run in the cloud, and cloud server area. Figure 3 shows sample views of the Carbon Monitor. Figure 3(a) shows a comparison of the carbon footprint to other activities, such as watching a movie, driving a car or household consumption.
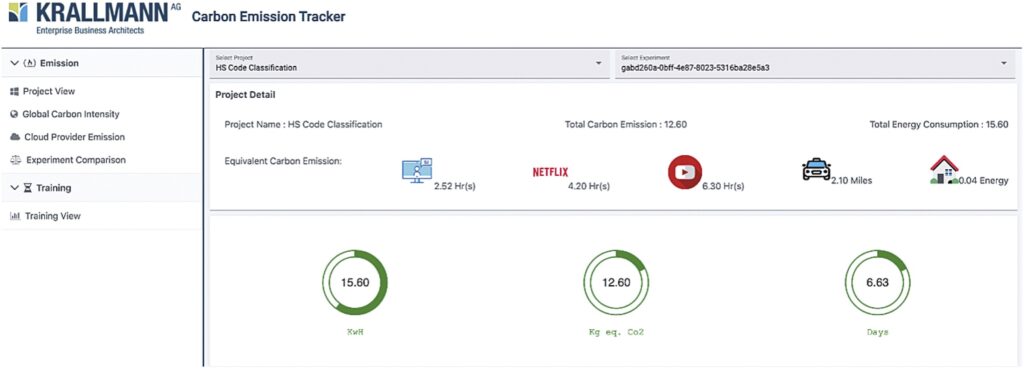
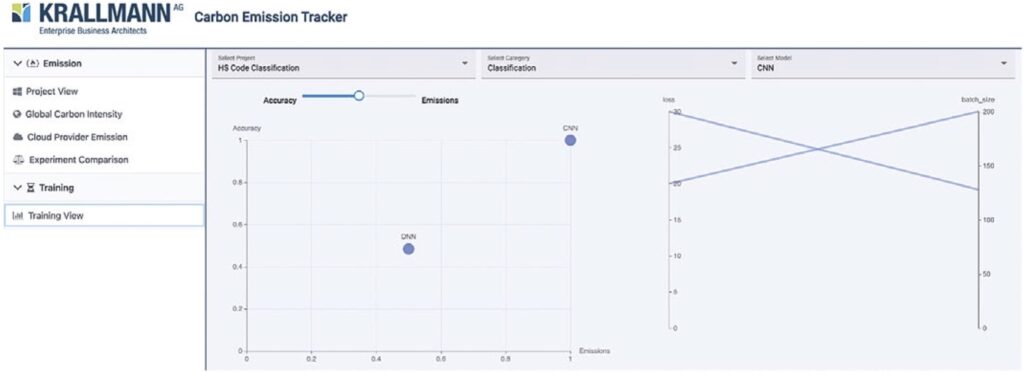
Figure 3(b) shows a comparison between the different models (here DNN and CNN). The user can select the relative importance of the accuracy vs. the carbon emissions and thus create a model ranking. In case of a management intervention, the AI energy consumption as well as the CO2 footprint can be improved by selecting the model that best meets the manager’s individual goals and trade-offs.
In order to present a more in-depth analysis of the AI’s greenness, the tool allows for a trade-off between (1) the accuracy of the AI’s results, (2) the computation time the corresponding AI use case has taken, (3) the energy consumption [in kWh] the AI use case realization has taken, as well as (4) the carbon emissions [CO2 eq in kg] of the AI due to the AI use case realization.
This represents a first version of a measuring method for AI energy consumption (see artifact 2 in Figure 2). This allows management to identify a more versatile trade-off, so that the greenest AI can be selected, with the lowest possible energy consumption and carbon emissions, while still providing AI results in a timely manner and with a justifiable level of accuracy. A real-world use case of this will be presented in the next section.
Demonstrating and testing the monitor: commodity code classification example
This section provides a real-world use case for creating a Green AI in the context of a logistics company and exemplifies the construction of a Green AI by the trade-off of the four dimensions: (1) accuracy, (2) computing time, (3) energy consumption as well as (4) carbon emissions. In the context of the design-science-oriented research presented, it demonstrates the Green AI construction and proves the functioning of the Carbon Monitordeveloped on a realistic validation level.
The AI’s task is the prediction of commodity codes in international shipments based on the senders’ item descriptions. As a side note for clarification, a commodity code is a generic term for several goods in foreign trade. The World Customs Organization specified the “Harmonized System (HS)” which is used by many countries. Many regions or economic areas have extended this system. The commodity codes play an essential role in transporting goods across borders.
The correct classification is crucial to prevent delays or seizures due to customs controls. It is important for the sender or business owner to fill out the correct codes either in electronic form or on paper. Even more so, it is a legal responsibility to use the correct code. Because of the complex nature of the coding systems, this can be very prone to error. Complicating matters, a correct code for a delivery to the EU may be incorrect for a delivery to the US.

The HS is made up of general interpretative rules (GIRs), sections, chapters, headings, and subheadings, as shown in Figure 4. The GIRs are rules providing the principles for the classification of goods/commodities by utilizing HS. They are divided into 21 sections which are then divided into chapters. The HS has 99 chapters, which are further divided into headings assigned with four-digit codes.
Finally, the headings are divided into subheadings and are assigned six-digit codes.
As the manual process of HS code correction and prediction is facing problems due to low efficiency and accuracy, automatic HS code classification using senders’ description (declaration) text for the commodity is imperative. Moreover, the automation of HS code classification will solve the problems of dealing with a huge amount of data, bias, and different judgment criteria.
Deep learning models have become the most popular methods for text classification [24]. Nowadays, pre-trained language models such as BERT [25] and ELMo [26] have achieved remarkable results in text classification and categorization. Nevertheless, the task of text classification in the context of commodity code classification is challenging. Classification of the correct HS code based on short text descriptions is a complex problem due to the following:
- Textual descriptions are brief, which creates a sparse feature space.
- The textual descriptions are more likely not to follow natural language syntax and lack structure.
- The number of possible classes and labels for text classification is quite large compared to general classification tasks.
- Some product labels are more frequent than others.
- Spelling errors are common.
- Words, phrases, or complete descriptions that appear only once are frequent.
By following the AI construction methodology by [27], five different AI models were constructed, trained and tested (see artifact 5 in Figure 2). Relevant key facts about their construction and dataset setup, as well as their performance evaluation for commodity code forecasting, are presented below in the form of a benchmark. For this purpose, a dataset of imports from Germany, purchased from manifestDB, was used. The data is collected from customs and shipping carriers around the globe and published by manifestDB globally. The imported dataset contains records for shipments between 2015 and 2021.
The key fields in the import dataset for Germany are the following:
- Shipper name and address
- Vessel country code
- WGT (KGS)
- Consignee
- CMDT Code
- Customs Description
- Vessel Name
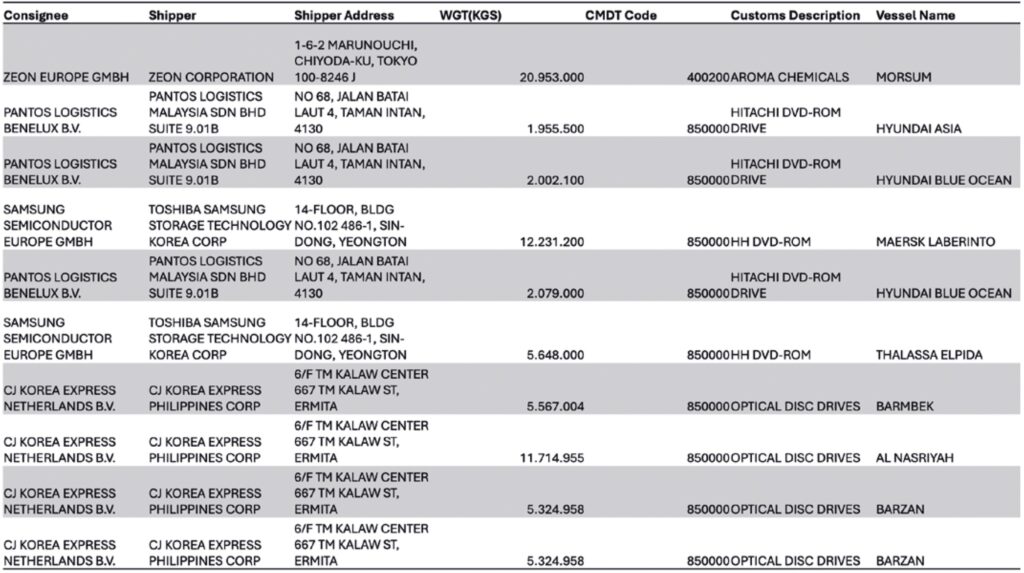
In order to present a data impression, Figure 5 displays a snapshot of the import dataset for Germany from 2015 to 2021. The fields required for the classification task were CMDT code (which is the HS code) and the text description labeled Customs Description.
The implementation phase followed a top-down approach by adopting the cross-industry standard process for data mining, CRISP-DM [28], which describes the common steps in the data science lifecycle. The steps involved are data preparation (preprocessing), data splitting, feature extraction, model selection, model training, and performance evaluation of the trained model. As part of the feature extraction phase, TF-IDF, BERT, GPT-2, and word embeddings (Word2Vec, Doc2Vec, FastText) are used to transform the canonical textual tokens into feature vectors suitable as input for training different classification models.
The commodity code predictions were based solely on the sender’s item description, which typically consisted of just five to six words. The different trained models are evaluated based on accuracy. The overall accuracy of our HS-6 prediction – after removing some HS codes with low prediction accuracy – is 82 % when using a CNN. The additional insights show that CNN outperforms ELMo as well as a combination of CNN and ELMo.
In addition, different word embeddings (Word2Vec, FastText, Doc2Vec) can substantially improve the resulting accuracy. “Simpler” Machine learning models, such as random forests, support vector machines (SVMs), and a Naïve Bayes classification, were benchmarked. Especially the SVM leads to promising results and is known to consume less energy.
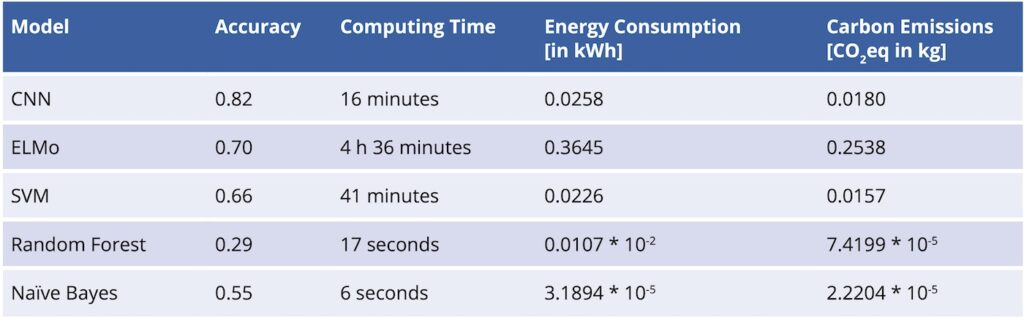
Figure 6 illustrates the accuracy and carbon emissions in CO2eq in kg for five models trained for HS code classification. The five different models are trained for the prediction of the correct HS code based on senders’ text descriptions and the Carbon Monitor is used to track the carbon emissions of each model during training. Because the experiment for training is run on a local device in Germany, DEU country constant is chosen for emissions tracking. This represents the AI use case of one training on a local device in the distributed infrastructure architecture of the “Test Center for Green AI” (see artifact 8 in Figure 2).
Each of the five models are trained five times and the carbon energy consumption, emissions, and accuracy are recorded. The design of the experiments allowed for the elimination of local outliers from the training runs. This helped in the identification of significant results (see artifact 6 in Figure 2). The goal was to build a model that meets the criteria of minimal carbon impact related to training and high-accuracy performance. Based on the strategy developed on a small subset of training data, it can be observed that the CNN model has the highest accuracy and the second-largest emissions.
The ELMo model has the second-highest accuracy and the highest carbon emissions. The smallest energy consumption and carbon emission can be found at Random Forest and Naïve Bayes. Regrettably, these show the worst performance in accuracy. Figure 7 visualizes the benchmark presented earlier. It will be provided by the Carbon Monitor and so simplifies the best option for an energy- and CO2-optimal AI.
Figure 7 presents the trade-off of the five AI models realized in the experiment runs described by showing the accuracy dimension on the y-axis and the emission dimension on the x-axis. On a first look, CNN seems to be the best option. However, an in-depth analysis based on Figure 6 and Figure 7 leads to the following conclusions.
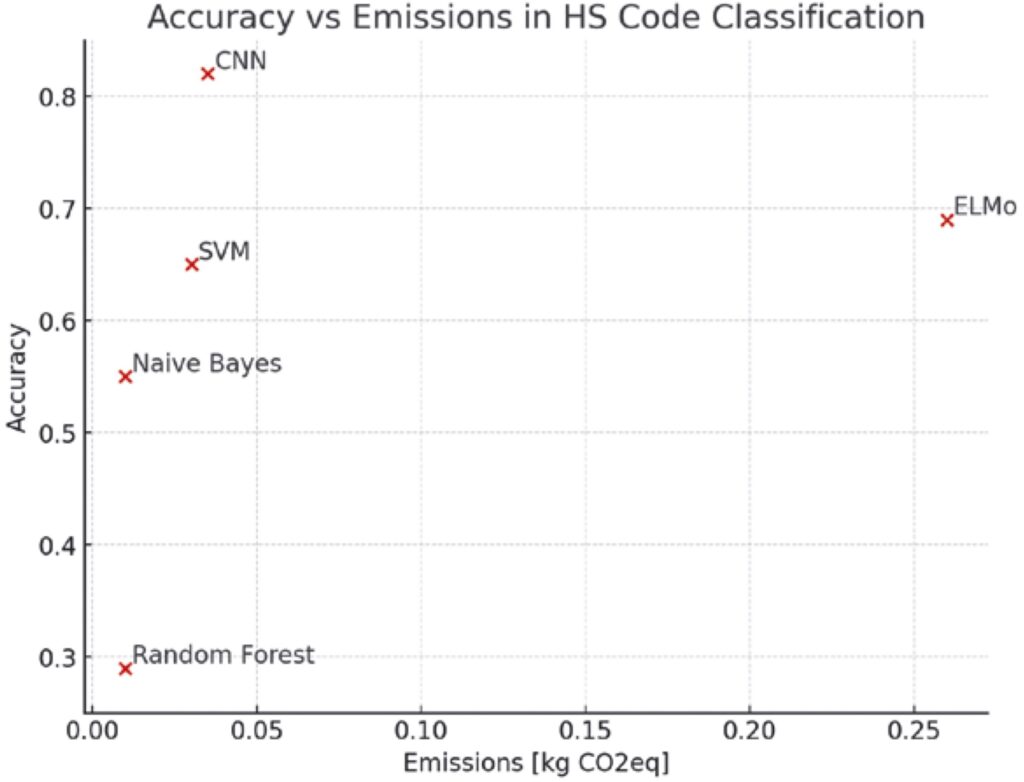
The decision for the selection of the final model depends on the acceptable threshold that the user sets for accuracy and emissions. Overall, this use case shows that it is important to make the model decision based on both accuracy and carbon emissions of a specific algorithm. Here, CNN is clearly the most accurate model and its carbon emissions are still reasonably low. Therefore, if there are no requirements for fast AI result generation, the decision for the commodity code classification use case is in favor of CNN.
While Random Forest and Naïve Bayes consume very little energy and thus emit little carbon, their accuracy is too low to benefit businesses. However, if a focus is set on fast computation, Random Forest and Naïve Bayes can be an option. Facing the better accuracy of Naïve Bayes compared to Random Forest, Naïve Bayes might be a better choice than CNN if results must be available in a short amount of time (e.g. less than 60 seconds).
Naïve Bayes seems to be the best option in this case. ELMo and SVM are not good options in any case. These show intermediate performance in accuracy and intermediate performance in computing time, energy consumption as well as carbon emission dimension. Slightly better accuracy performances can be found with ELMo compared to SVM, in relation the cost of computing time, energy consumption as well as carbon emissions. So, for instance, if there are some organization policies that disable the use of CNN, Random Forest, and Naïve Bayes, a real trade-off between ELMo and SVM is attractive.
Discussion and Outlook
The paper has created a structure of artifacts that are required to realize a Green AI. In addition, a monitoring of five sample AI applications for commodity code prediction was elaborated. In a benchmark, their performance was analyzed in detail by combining four dimensions as a measurement method for AI energy consumption, namely the dimensions of (1) accuracy, (2) computation time, (3) energy consumption, and (4) carbon emissions.
The demonstration and evaluation of the five AI application examples has led to a tricky trade-off situation. Here, the construction of a Green AI – in this example setting, this depends on the choice of the appropriate AI model – depends heavily on the prioritization of the dimensions (1) accuracy, (2) computation time, (3) energy consumption, and (4) carbon emissions, as well as the availability of organization policies. Each of the prioritization scenarios presented can lead to the selection of one of the AI models shown.
However, the experiments have only been realized using a local device within the distributed infrastructure architecture of the “Test Center for Green AI”.
Results might change if the realization of the corresponding AI-use-case is switched to one of the following variations:
(1) CPU versus GPU processing, (2) more powerful processing power, (3) alternative programming libraries, (4) different AI example applications, (5) different transfers to alternative computing devices in distributed infrastructures (e.g. from local processing to cloud processing), (6) further analysis dimensions as part of the measurement method for AI energy consumption, (7) alternative designs of energy and time limits, (8) the amount of training set entries, (9) the amount of data items, (10) the codification and decodification layout, (11) the AI model’s inner architecture, etc.
Therefore, research and experiments on the building will focus on their systematic study. Therefore, the best options for the creation and trade-off of Green AI will be further explored.
In addition, live analytics and live monitoring are particularly attractive because the AI’s (1) accuracy, (2) computation time, (3) energy consumption, and (4) carbon emissions can be managed on an ad hoc basis. In addition to the management option of identifying the best AI models that have been discussed so far, this will enable managers to intervene in unnecessary energy consumption and carbon emissions. For instance, they can just cancel training runs. This further contributes to realizing a green, energy-optimal and carbon-emission-optimal AI, because it requires no energy at all.
This research received funding by the Federal Ministry for Economic Affairs and Climate Action on the basis of a decision by the German Bundestag under Grant Agreement number KK5272103MS3.
Bibliography
[1] Owusu, P. A., & Asumadu-Sarkodie, S. (2016). A review of renewable energy sources, sustainability issues and climate change mitigation. Cogent Engineering, 3(1), 1167990.[2] United Nations. (2015). Transforming our world: the 2030 Agenda for Sustainable Development. Accessed October 20, 2024: https://www.refworld.org/docid/57b6e3e44.html.
[3] IPCC. (2022). Climate Change 2022: Impacts, Adaptation, and Vulnerability. Contribution of Working Group II to the Sixth Assessment Report of the Intergovernmental Panel on Climate Change. Edoc UniBasel. Accessed January 30, 2024: https://edoc.unibas.ch/91322/
[4] IPCC. (2014). Klimaänderung 2014. Synthesebericht. Accessed January 30, 2024: https://www.ipcc.ch/site/assets/uploads/2018/02/IPCC-AR5_SYR_barrierefrei.pdf.
[5] IDC & Statista. (June 7, 2021). “Volume of data/information created, captured, copied, and consumed worldwide from 2010 to 2020, with forecasts from 2021 to 2025”(in zettabytes) [Graph]. In Statista. Accessed December 20, 2024: https://www.statista.com/statistics/871513/worldwide-data-created/.
[6] Siddik, M. A. B., Shehabi, A., & Marston, L. (2021). The environmental footprint of data centers in the United States. Environmental Research Letters, 16(6), 064017.
[7] Sachs, G., 2024. AI is poised to drive 160% increase in data center power demand. Goldman Sachs Insights, 14.
[8] Climate Watch (2023) – with major processing by Our World in Data. “Agriculture” [dataset]. Climate Watch, “Greenhouse gas emissions by sector” [original data]. https://ourworldindata.org/grapher/ghg-emissions-by-sector
[9] Freitag, C., Berners-Lee, M., Widdicks, K., Knowles, B., Blair, G., & Friday, A. (2021). The climate impact of ICT: A review of estimates, trends and regulations. arXiv preprint arXiv:2102.02622.
[10] DHL. (2022) Green product portfolio. Retrieved May 24, 2024, from https://www.dpdhl.com/en/sustainability/environment/green-product-portfolio.html.
[11] International Energy Agency. (2017). Digitalisation and energy. Accessed June 6, 2024: https://www.iea.org/reports/digitalisation-and-energy.
[12] Strubell, E., Ganesh, A., & McCallum, A. (2019). Energy and policy considerations for deep learning in NLP. arXiv preprint arXiv:1906.02243.
[13] Schwartz, R., Dodge, J., Smith, N.A. and Etzioni, O., 2020. Green ai. Communications of the ACM, 63(12), pp.54-63.
[14] Murugesan, S. (2008). Harnessing green IT: Principles and practices. IT professional, 10(1), 24-33.
[15] Grum, M., Sultanow, E., Friedmann, D., Ullrich, A., & Gronau, N. (2020). Tools des Maschinellen Lernens. GITO Verlag. https://doi. org/10.30844/grum_2020
[16] Masson-Delmotte, V., Zhai, P., Pirani, A., Connors, S. L., Péan, C., Berger, S., & Zhou, B. (2021). Climate change 2021: the physical science basis. Contribution of working group I to the sixth assessment report of the intergovernmental panel on climate change, 2.
[17] Grosan, C., & Abraham, A. (2011). Intelligent systems (Vol. 17, pp. 261-268). Berlin: Springer.
[18] Thomsen, M. (2015). Microsoft’s Deep Learning Project Outperforms Humans in Image
Recognition. Forbes Magazine. Retrieved February 19, 2022, from https://www.forbes.com/sites/michaelthomsen/2015 02/19/microsofts-deep-learning-project outperforms-humans-in-image-recognition/.
[19] Lannelongue, L., Grealey, J., & Inouye, M. (2021). Green algorithms: quantifying the carbon footprint of computation. Advanced science, 8(12), 2100707.
[20] Hernandez, D., & Brown, T. B. (2020). Measuring the algorithmic efficiency of neural networks. arXiv preprint arXiv:2005.04305.
[21] Peffers, K., Tuunanen, T., Rothenberger, M. A., & Chatterjee, S. (2007). A design science research methodology for information systems research. Journal of management information systems, 24(3), 45-77.
[22] Grum, M., Bender, B., Alfa, A. S., & Gronau, N. (2018). A decision maxim for efficient task realization within analytical network infrastructures. Decision Support Systems, 112, 48-59.
[23] Rojahn, M. and Gronau, N., 2024. Openness Indicators for the Evaluation of Digital Platforms between the Launch and Maturity Phase.
[24] Nam, J., Kim, J., Loza Mencía, E., Gurevych, I., & Fürnkranz, J. (2014). Large-scale multi-label text classification—revisiting neural networks. In Machine Learning and Knowledge Discovery in Databases: European Conference, ECML PKDD 2014, Nancy, France, September 15-19, 2014. Proceedings, Part II 14 (pp. 437-452). Springer Berlin Heidelberg.
[25] Devlin, J., Chang, M. W., Lee, K., & Toutanova, K. (2018). Bert: Pre-training of deep bidirectional transformers for language understanding. arXiv preprint arXiv:1810.04805.
[26] Sarzynska-Wawer, J., Wawer, A., Pawlak, A., Szymanowska, J., Stefaniak, I., Jarkiewicz, M., & Okruszek, L. (2021). Detecting formal thought disorder by deep contextualized word representations. Psychiatry Research, 304, 114135.
[27] Grum, M. (2022). Construction of a concept of neuronal modeling. Springer Nature. URL: https://doi.org/10.1007/978-3-658-35999-7.
[28] Wirth, R., & Hipp, J. (2000, April). CRISP-DM: Towards a standard process model for data mining. In Proceedings of the 4th international conference on the practical applications of knowledge discovery and data mining (Vol. 1, pp. 29-39).
Your downloads
Potentials: Management Resource Efficiency
Solutions: Process Management Risk Management